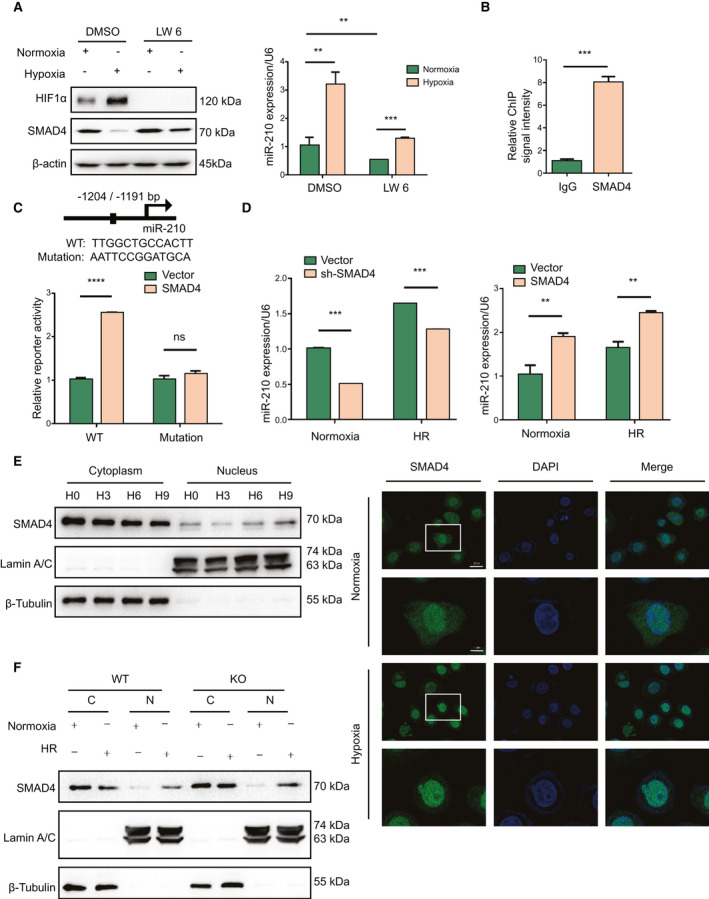
Fig. 6.

SMAD4 promotes miR‐210 expression. (A) Western blot analysis of indicated protein levels and quantitative PCR analysis of miR‐210 expression in LO2 cells treated with HIF1α inhibitor LW6 (20 μM) under normoxia or hypoxia (n = 3, **P < 0.01, ***P < 0.001). (B) ChIP analysis of the binding of SMAD4 to miR‐210 promoter (n = 3, ***P < 0.001). (C) SMAD4 binding sequence on miR‐210 promoter predicted by JASPAR database and luciferase analysis of the effect of SMAD4 on miR‐210 promoter activity in LO2 cells (n = 3, ****P < 0.0001). (D) Quantitative PCR analysis of miR‐210 expression in LO2 cells transfected with indicated plasmids under normoxia or HR stimulation (n = 3, **P < 0.01, ***P < 0.001). (E) Cell fractionation western blot analysis and immunofluorescence analysis of the cellular distribution of SMAD4 in LO2 cells following normoxia or 6 hours of hypoxia (63× lens, scale [up] = 25 μm, scale [down] = 7.5 μm). (F) Cell fractionation western blot analysis of SMAD4 in primary hepatocytes following normoxia or HR.
