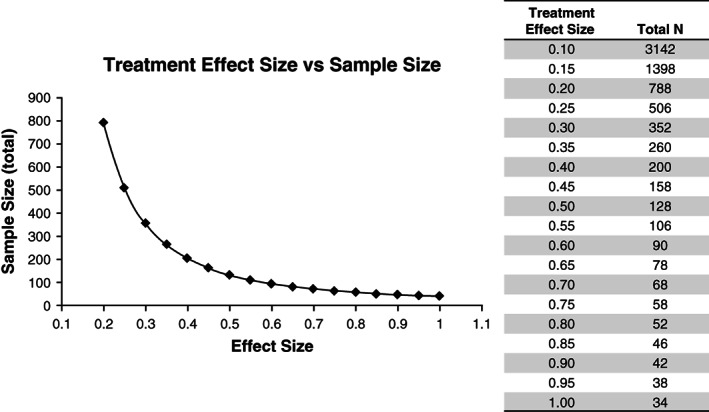
FIG. 3.

Required sample sizes for 2‐group comparisons for given treatment effect sizes.a The figure contains sample sizes for a t test, 80% power, and a significance level (P value) = .05. Total N is the combined sample size for 2 groups, assuming 50% of participants per group. aThese sample sizes should be considered rough generic estimates. A realistic trial size determination would consider additional effects such as assumed drop‐out rates, possible uneven treatment–placebo allotment ratios, and placebo effects. Crucially, a realistic trial size also depends on defining a suitable clinically meaningful treatment effect to be detected. The example of 50% is meant only for illustration of sample size principles.
