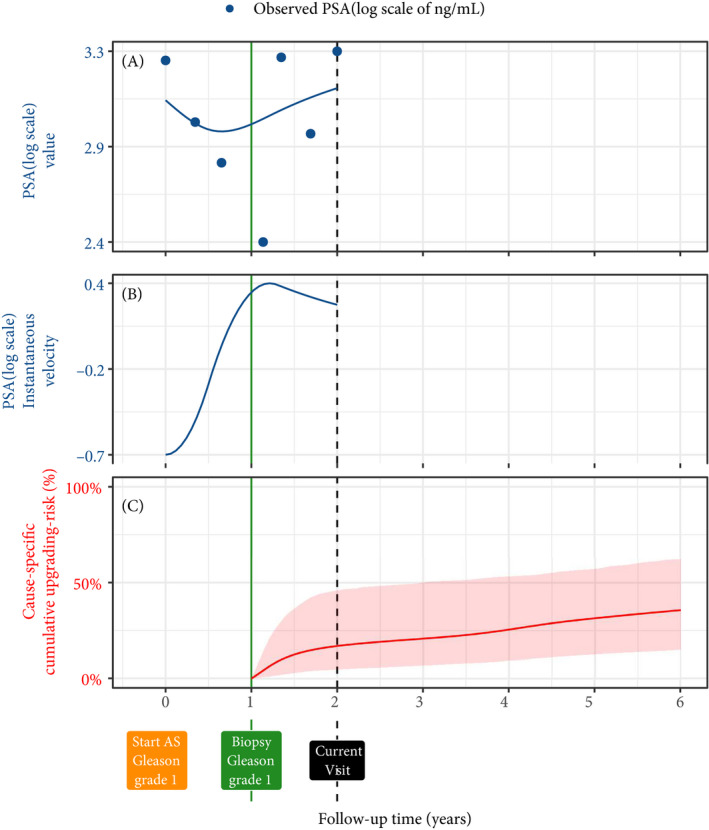
Fig. 3.

Illustration of the joint model on a real PRIAS patient. Panel A: Observed PSA (blue dots) and fitted PSA (solid blue line), log‐transformed from ng/mL. Panel B: Estimated instantaneous velocity of PSA (log‐transformed). Panel C: Predicted cause‐specific cumulative upgrading risk (95% credible interval shaded). Upgrading is defined as an increase in the GGG1 to GGG≥2 [2]. This upgrading risk is calculated starting from the time of the latest negative biopsy (vertical green line at 1 year of follow‐up). The joint model estimated it by combining the fitted PSA (log scale) level and instantaneous velocity, and time of the latest negative biopsy. Black dashed line at 2 years denotes the time of current visit.
