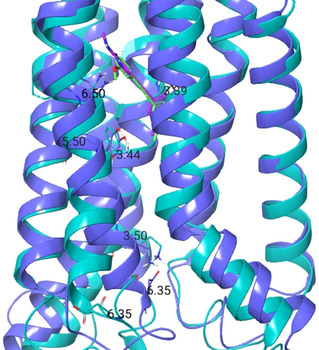
Figure 3.

The 7TM regions of active and inactive mGlu5 with allosteric ligands 6 (magenta) and M‐MPEP (green), respectively. The active structure (the homology model of which was prepared based on the μ‐opioid receptor‐Gi protein complex (PDB ID: 6DDE [112] ) as is written in ref. [52]) is depicted in cyan, the inactive (PDB ID: 6FFI) is in blue. Trigger switch, transmission switch, and “ionic lock” amino acids are represented as cyan and grey sticks.
