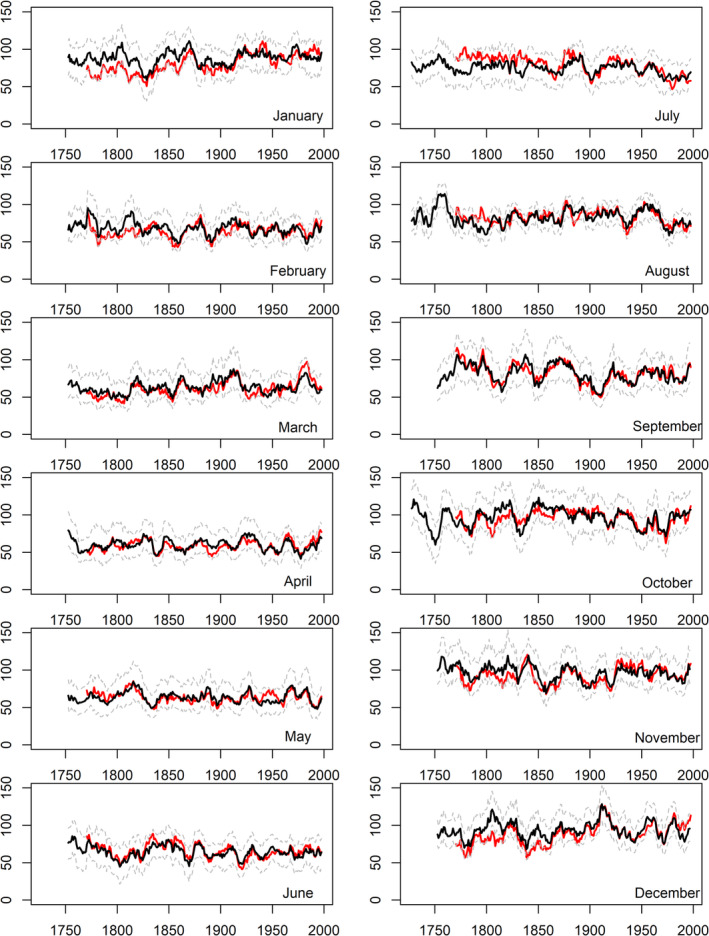
Figure 3.

Observed (red) and reconstructed (black) decadal mean monthly precipitation totals (mm) for EWP. Dashed grey lines represent the 90% confidence interval of model reconstructions based on 1,000 bootstrap samples of the calibration data (see Section 2)
