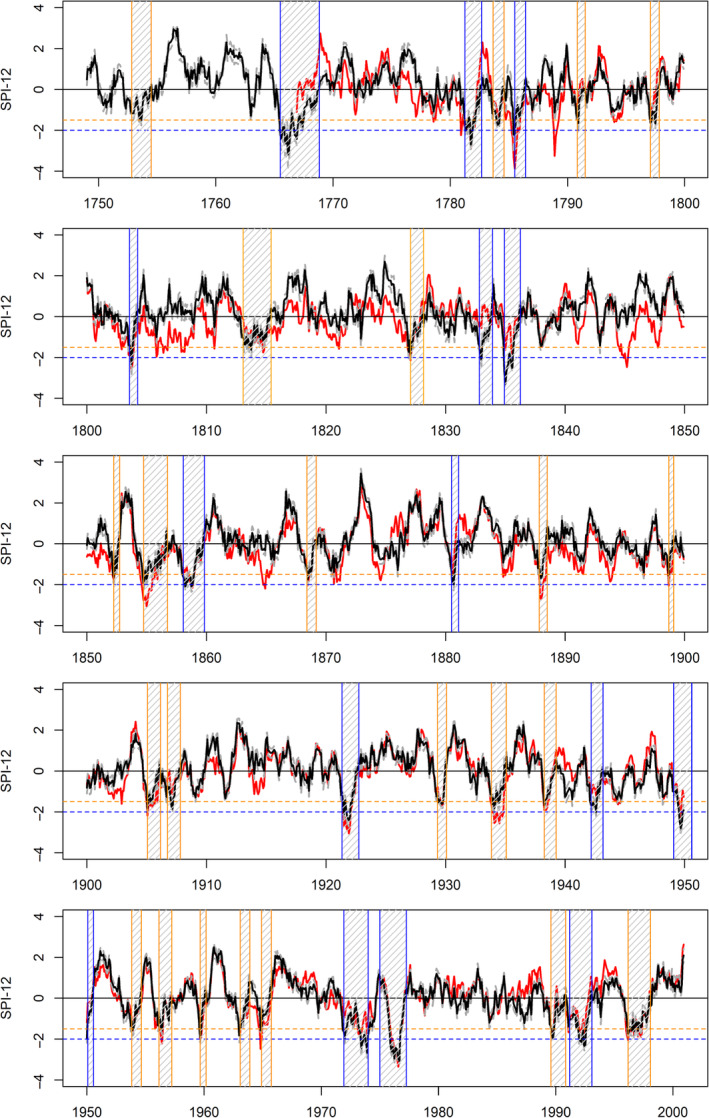
Figure 6.

Observed (red) and median reconstructed (black) SPI‐12 series for EWP. Each panel shows an approximate 50 years block. Shaded areas are severe (orange) and extreme (blue) drought events. The dashed orange horizontal line shows the SPI‐12 threshold for classification as severe drought, while the dashed blue horizontal line shows the threshold for classification as extreme drought. Dashed grey lines represent the 90% confidence intervals for the reconstructed SPI‐12 series
