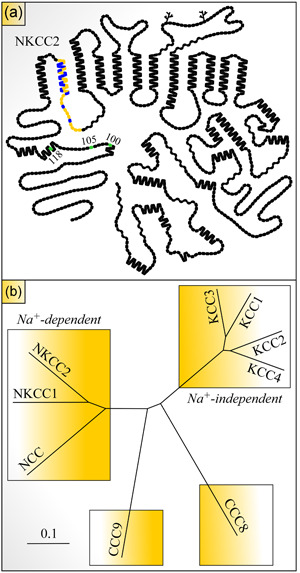
Figure 1.

Hydropathy plot model of NKCC2 and phylogram of CCC family. (a) Residues are shown as round or square forms (one form per residue) and putative glycosylation sites as branched lines. Residues in yellow are those of the alternatively spliced exon, residue in blue differ among the variants, and residues in green correspond to known phosphoacceptor sites in the N‐terminus. The model was drawn using the program PLOT. (b) The tree was constructed through the programs Clustal Omega and FigTree v1.4.3 (Sievers et al., 2011) using the longest human (hu) residue sequences for each of the CCCs shown. Members of this family belong to four different subclasses. The scale corresponds to a genetic distance. Sequences used: NKCC1, NP_001037.1; NKCC2, NP_000329.2; NCC, NP_000330.2; KCC1, NP_005063.1; KCC2, NP 001128243.1; KCC3, NP_598408.1; KCC4, NP_006589.2; CCC8, NP_064631.2; CCC9, NP_078904.3. CCC, cation‐Cl− cotransporter; KCC1, K+–Cl− cotransporter 1; NCC, Na+–Cl− cotransporter; NKCC2, Na+–K+–Cl− cotransporter 2
