
Figure 5.
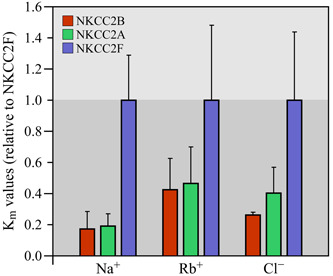
Apparent affinities of Na+–K+–Cl− cotransporter 2 (NKCC2) splice variants for Na+, Rb+, and Cl−. The data shown correspond to mean K m ratios ± standard error among three independent studies (as described in the text). In each study, these ratios were obtained by dividing the mean K m determined for either variant with the mean K m determined for NKCC2F. These constants are all seen to be higher for NKCC2F and analogous between NKCC2A and NKCC2B. On the basis of our observations, V max was also found to be higher for NKCC2F and similar between NKCC2A and NKCC2B (not shown)