
Figure 6.
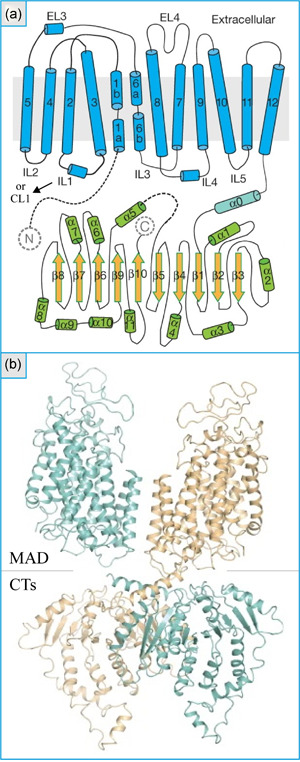
Structure of zebrafish Na+–K+–Cl− cotransporter 1 based on a cryo‐electron microscopy density map. (a) Topology model of a monomer. Are shown: the transmembrane domains, extracellular loops (ELs), intracellular loops (ILs; also called connecting loops [CLs] in the text), linker helix (α0), as well as α‐ and β‐helices in the C‐terminus. (b) Structural model of a dimer. Are seen: the membrane‐associated domain (MAD) and the C‐termini (CTs). Adapted with permission from Xu et al. (1994)