Figure 3.

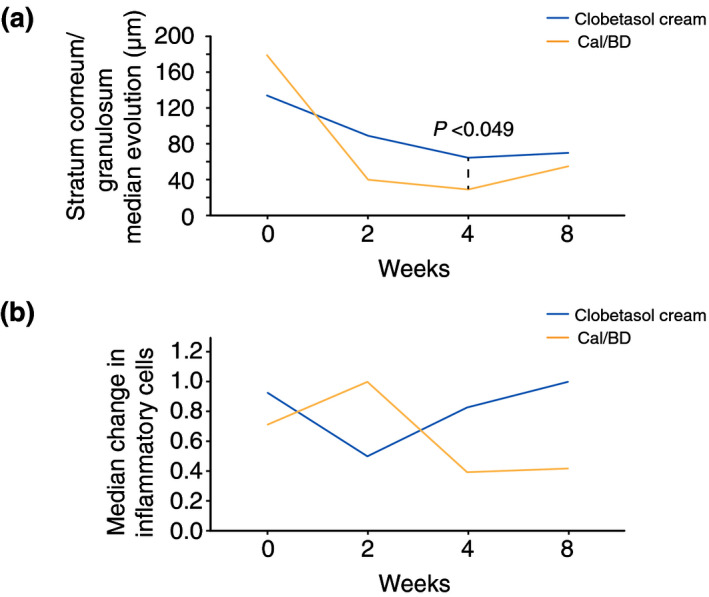
Line graphs showing the evolution of relevant microscopic findings. Panel (a) shows the evolution of the epidermal thickness measured with OCT. Panel (b) shows the evolution of inflammatory cells identified using RCM.

Line graphs showing the evolution of relevant microscopic findings. Panel (a) shows the evolution of the epidermal thickness measured with OCT. Panel (b) shows the evolution of inflammatory cells identified using RCM.