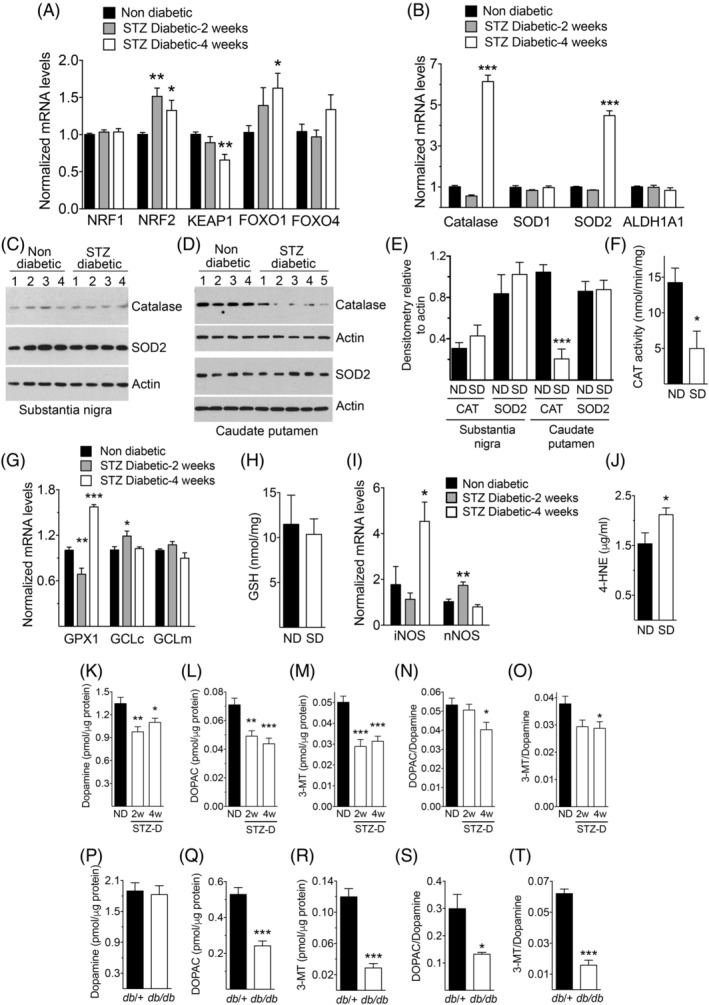
FIG. 1.

Oxidative stress in the SN and CPu. (A,B) Levels of mRNAs encoding oxidative stress‐related transcription factors (A) or oxidative stress‐scavenging enzymes (B) in the SN (n = 4–8 in [A] and 6–8 in [B]). (C,D) Western blots with lysates from the SN (C) or the CPu (D) of nondiabetic or STZ‐treated 4‐week diabetic mice. The numbers on top of each lane indicate individual mice from which samples were obtained. (E) Densitometric quantification of the intensities of the catalase (CAT) and SOD2 bands from panels (C) and (D). (F) Catalase activity in CPu homogenates (n = 3 per group). (G) Expression of mRNAs encoding glutathione‐related enzymes in the SN (n = 5–8 per group). (H) GSH production in CPu homogenates (n = 8 per group). (I) Expression of mRNAs encoding iNOS or nNOS in the SN (n = 6–7 per group). (J) Levels of the ROS indicator product 4‐HNE in CPu homogenates (n = 11 for ND and 9 for SD). (K–T) Levels of dopamine and its metabolites, DOPAC and 3‐MT, in CPu homogenates from nondiabetic and STZ‐treated diabetic mice (K–O, n = 6 per group) or from db/+ control and db/db diabetic mice (P–T, n = 4 per group). * P < 0.05; ** P < 0.01; *** P < 0.001 versus nondiabetic controls, one‐way ANOVA followed by Dunnett's post‐hoc test (A,B,G,I,K–O) or Student's t test (E,F,J,Q–T). ND, nondiabetic; SD, STZ‐treated diabetic (4‐week, unless otherwise indicated in [K–O]); GPX1, glutathione peroxidase 1; GCL, glutamate‐cysteine ligase, catalytic (c) or modulatory (m) subunits
