
FIG. 3.
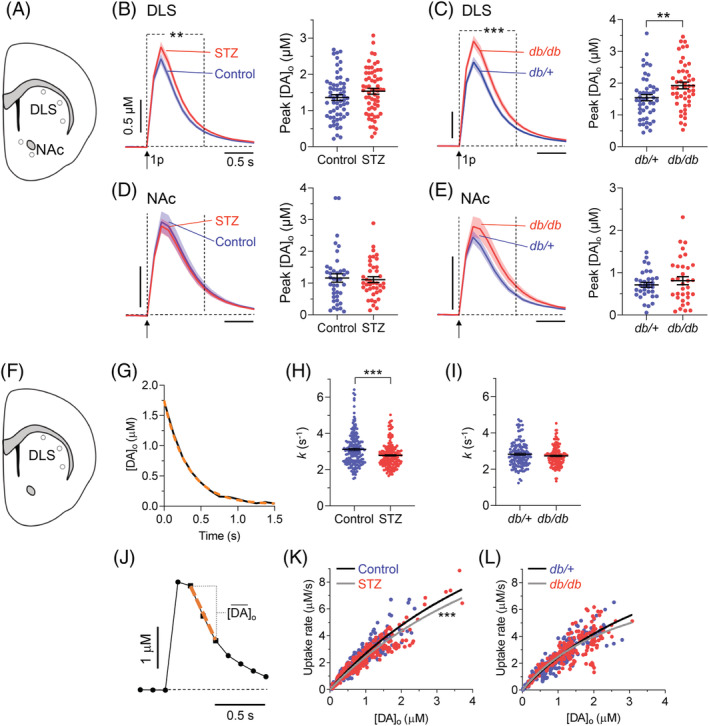
Dopamine release and uptake kinetics in the striatum. (A) Schematic depiction showing DLS and NAc regions sampled with FSCV. (B,D) Left: mean profiles of [DA]o ± SEM evoked by a single electrical pulse in DLS (B; n = 61 recordings; P = 0.06, paired Student's t test) or NAc (D; n = 40 recordings) in vehicle‐treated nondiabetic controls (blue) or STZ‐treated 4‐week diabetic mice (red); ** P < 0.01, two‐way ANOVA between dotted lines, treatment × time interaction, F 8,960 = 2.682. Right: population data and mean ± SEM for peak [DA]o; * P < 0.05, paired Student's t test. (C and E) Left: mean profiles of [DA]o ± SEM evoked by a single electrical pulse in DLS (C; n = 48 recordings) or NAc (E; n = 33 recordings) in db/+ nondiabetic controls (blue) and db/db diabetic mice (red); *** P < 0.0001, two‐way ANOVA between dotted lines, treatment x time interaction, F 8,752 = 4.422. Right, population data and mean ± SEM for peak [DA]o; ** P < 0.01, paired Student's t test. Population data sets in (B–E) were checked for outliers with Grubb's test (α = 0.05). (F) Schematic depiction showing DLS regions assessed for uptake kinetics. (G) Representative fit (orange dashed) of a one‐phase exponential decay curve approximation to the falling phase of a typical extracellular dopamine profile (black; R2 = 0.99). (H,I) Population data and mean ± SEM for exponential decay constants (k) from approximation to one‐phase exponential decay fit calculated for each DA transient in STZ‐diabetic versus controls (H; n = 188; mean R2 > 0.98) or in db/db versus db/+ (I; n = 142; mean R2 > 0.99). *** P<0.0001, Student's t test. (J) A typical [DA]o profile showing points of sampling the maximum [DA]o decay rate (dashed orange line), and mean [DA]o observed at this rate, for construction of a Michaelis‐Menten plot in (K,L). (K,L) Plot of maximum decay rate for each transient versus mean [DA]o at that rate with Michaelis‐Menten curve fits for STZ‐diabetics (Vmax = 20.1 ± 2.3 μM/s; R2 = 0.88) versus nondiabetic controls (Vmax = 22.0 ± 2.6 μM/s; R2 = 0.83; Km constrained to an equal value of 7.23 μM [K]; *** P < 0.0001) and for db/db (Vmax = 11.97 ± 1.23 μM/s; R2 = 0.67) versus db/+ (Vmax = 12.3 ± 1.3 μM/s; R2 = 0.83) mice (Km constrained to an equal value of 3.9 μM for both genotypes; L). STZ‐diabetics versus controls, n = 10 pairs; db/db mice versus db/+ controls, n = 8 pairs. [Color figure can be viewed at wileyonlinelibrary.com]