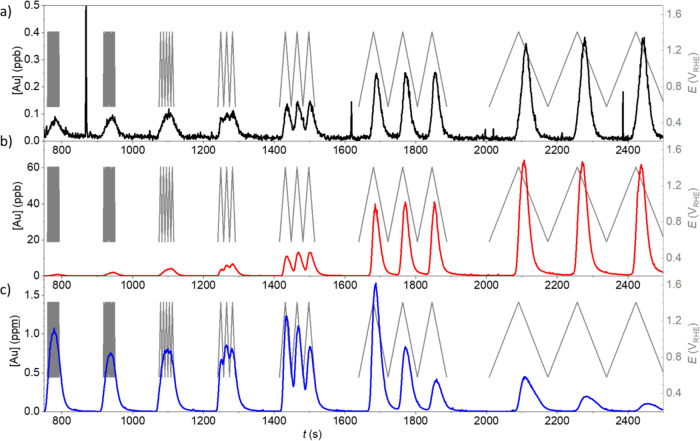
Figure 6.
Au dissolution profiles of the Au/C in (a) 0.05 M H2SO4, (b) 0.05 M H2SO4 + 10–4 Cl–, and (c) 0.05 M H2SO4 + 10–2 Cl–. The applied potential protocol was the same in all three cases. First, 20 activation cycles (0.28–1.58 VRHE, 100 mV/s) were applied in chloride-free 0.05 M H2SO4 (not shown). For experiments in the chloride-containing electrolyte, the electrolyte was then switched during the 5 min wait period following the activation. The following cycles (shown in the graph) were recorded in the AST potential range, namely, 0.58–1.41 VRHE with a varying scan rate: 1000 mV/s (20 cycles), 500 mV/s (10 cycles), 200 mV/s (5 cycles), 100 mV/s (3 cycles), 50 mV/s (3 cycles), 20 mV/s (3 cycles), and 10 mV/s (3 cycles). Sets of cycles were separated by 2 min of open circuit potential to allow background stabilization.

