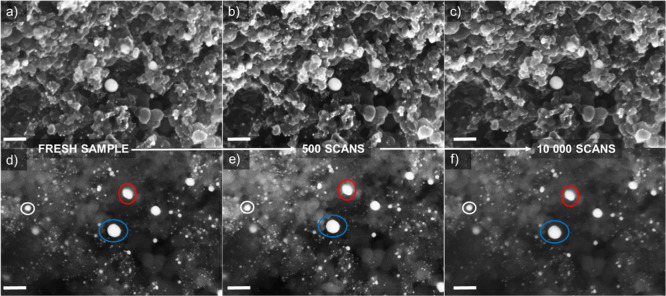
Figure 7.
IL-SEM imaging of the Au/C sample during AST in neat 0.05 M H2SO4: (a,d) fresh sample; (b,e) after 500 scans; (c,f) after 10,000 scans. The potential window used for AST was between 0.58 and 1.41 VRHE, while the scan rate was 1 V/s. Scale bars correspond to 100 nm. The upper row of images was obtained using an in-lens detector, while the lower row was obtained using a SE2 detector.

