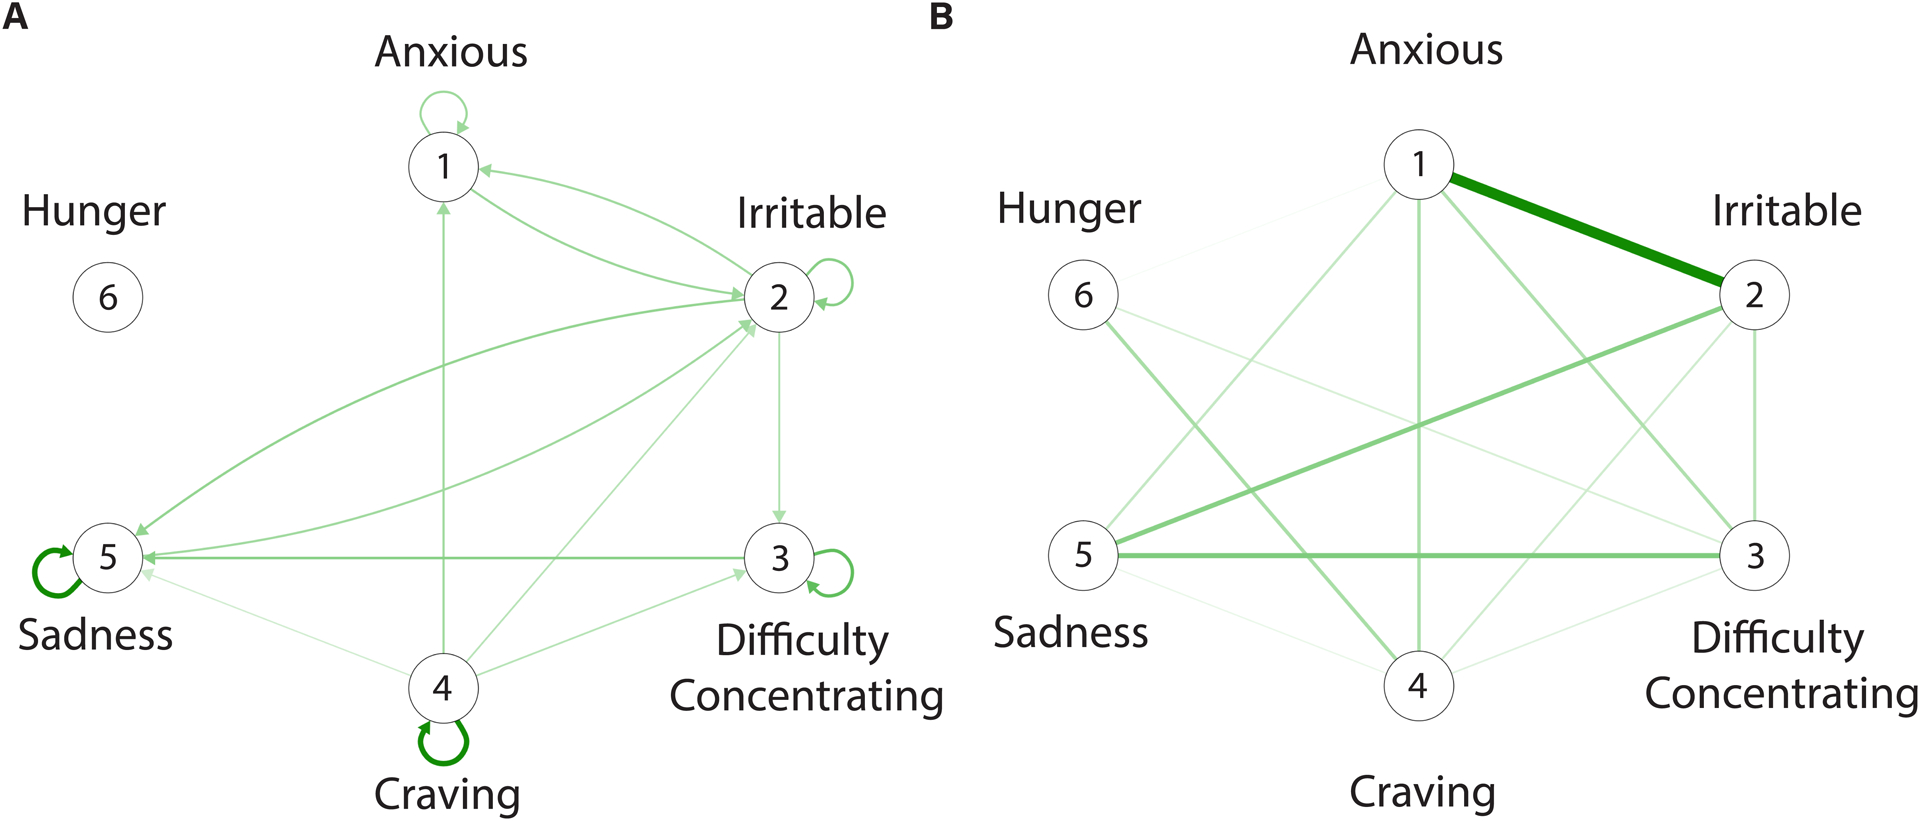
Figure 1.

Dynamic networks of tobacco withdrawal. A. A temporal network in which the nodes (circles) represent symptoms and the edges represent the association between symptoms from one measurement occasion to the next. B. A contemporaneous network in which the edges represent the co-occurrence of symptoms at the same measurement occasion while controlling for temporal effects and the effects of other symptoms. Only green edges are observed in the networks indicating that the experience of increases in withdrawal symptoms tend to be associated with increases in the experience of other symptoms (e.g., when sadness is higher than usual, anxiety is higher than usual). Both temporal and contemporaneous networks are estimated by pooling data across all participants in the sample and, thus, edges represent the prototypical associations among symptoms.
