Figure 2.

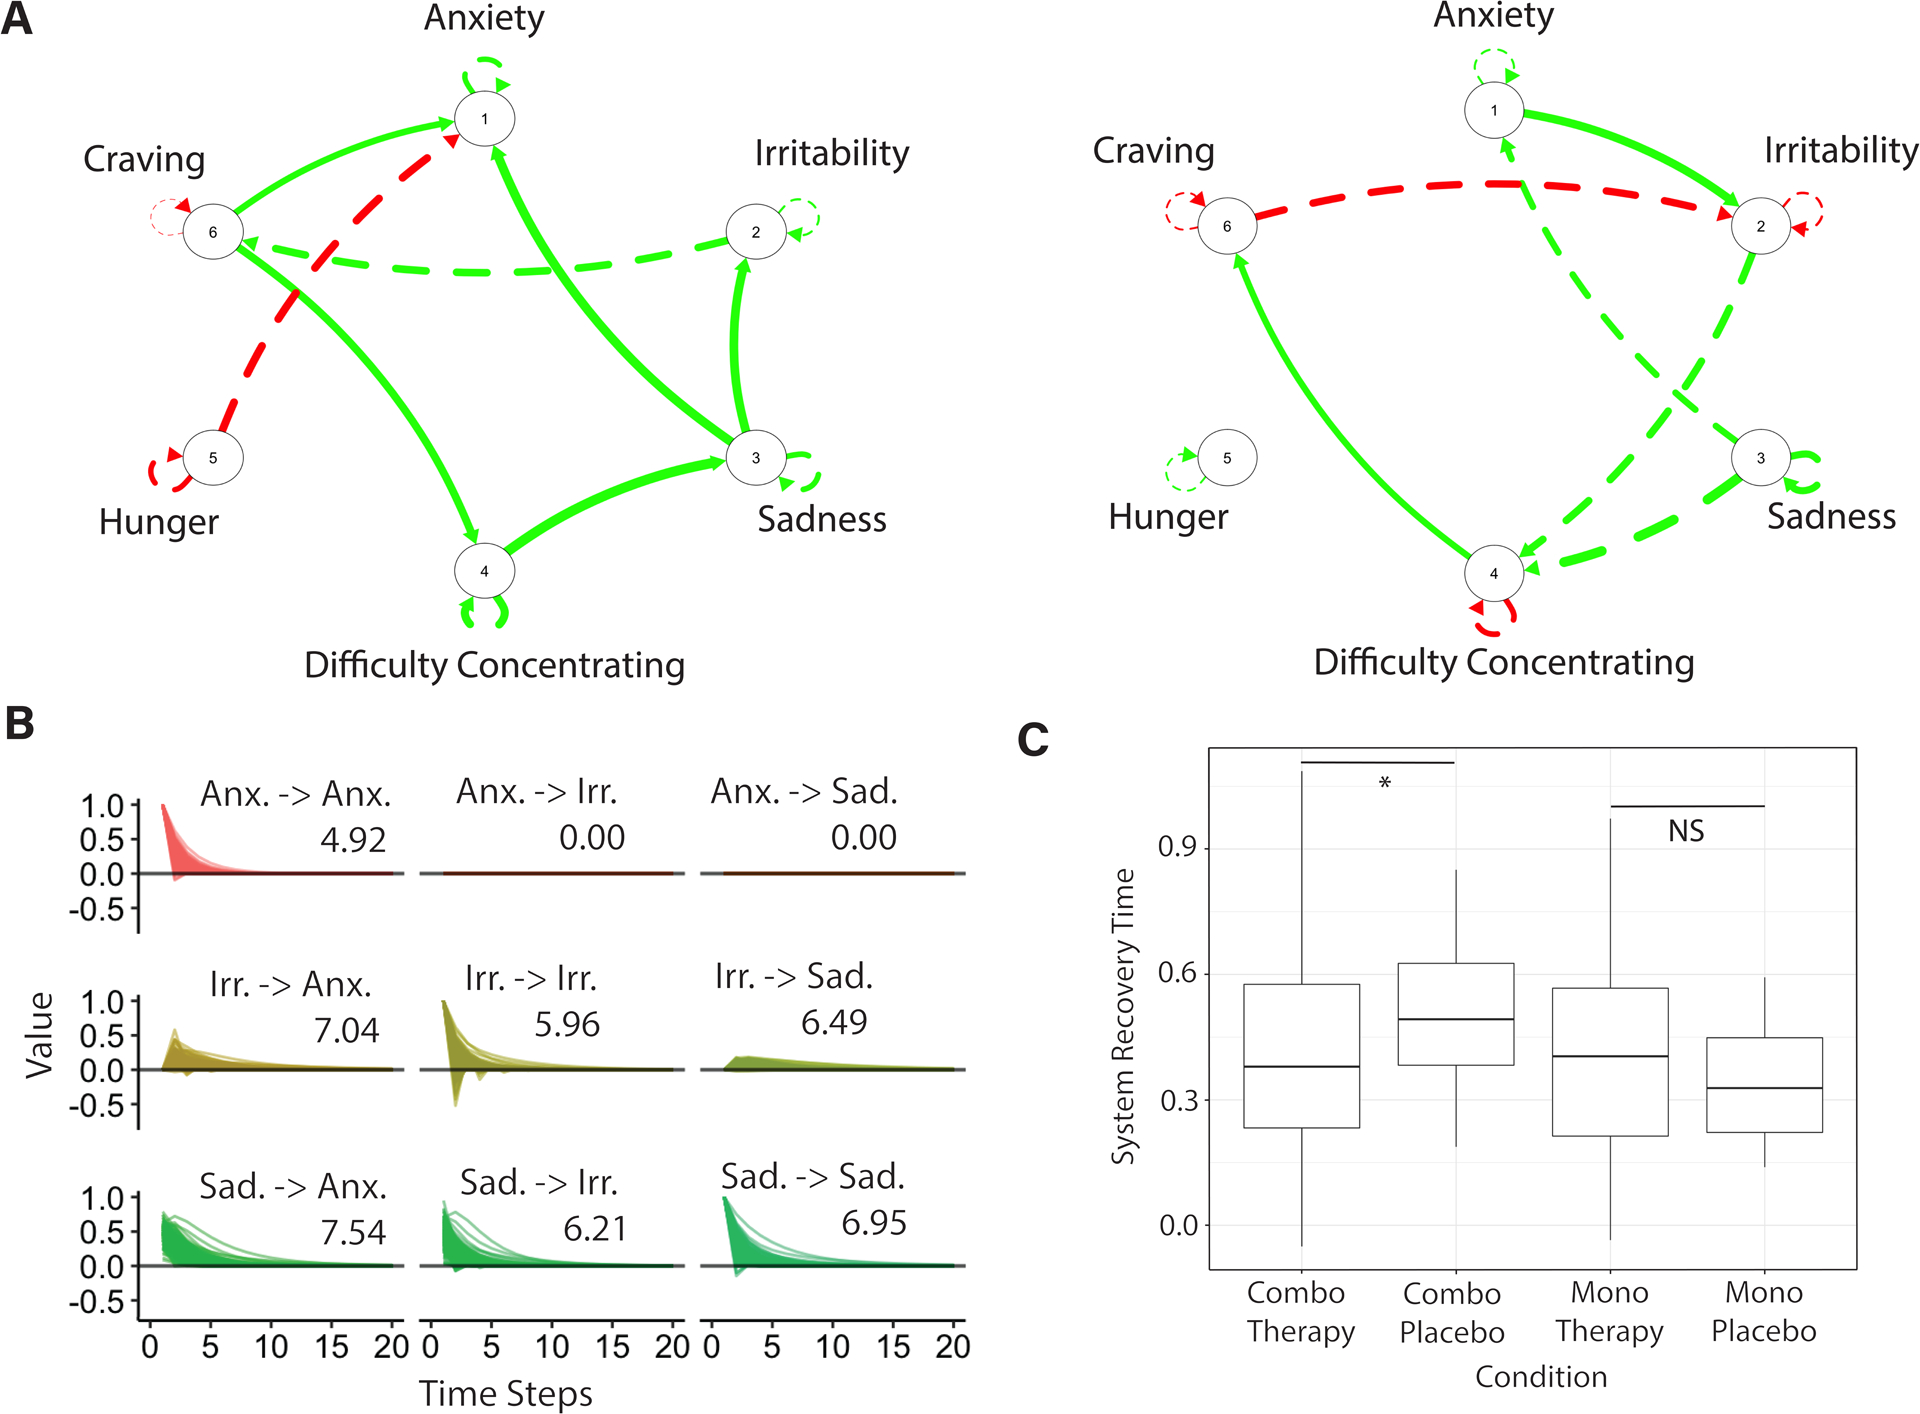
Person-specific networks of tobacco withdrawal. A. Two graphs estimated using a unified Structural Equation Model on experience-sampling data show the temporal associations (edges) among individual withdrawal symptoms (nodes) across time for two different participants. Red edges show negative associations; green edges show positive associations; dashed edges are lagged associations; and continuous edges are contemporaneous associations. Notable is the heterogeneity in network structure across the two participants. B. A sample matrix of recovery times associated with the network on the left in panel A, and estimated using impulse response analysis, indicates the time it takes for a symptom to return to equilibrium after being perturbed. For example, when an increase in anxiety is simulated, it takes 4.92 time steps for anxiety to return to baseline (as indicated by the Anx. -> Anx label). A subsample of three symptoms (anxiety, irritability, and sadness) of the full six symptom matrix is shown to enhance readability. C. Independent samples t-tests show higher log system recovery times in the symptom networks of participants in the combination therapy placebo condition (non-log mean value = 3.55) relative to participants in the active combination therapy condition (non-log mean value = 3.05). No differences in system recovery time emerges for participants in the active (non-log mean value = 2.88) or placebo monotherapy (non-log mean value = 2.39) groups. Notes: Anx.=anxiety; Irr. = irritablility; Sad. = sadness; *p=0.03; NS = non-significant.
