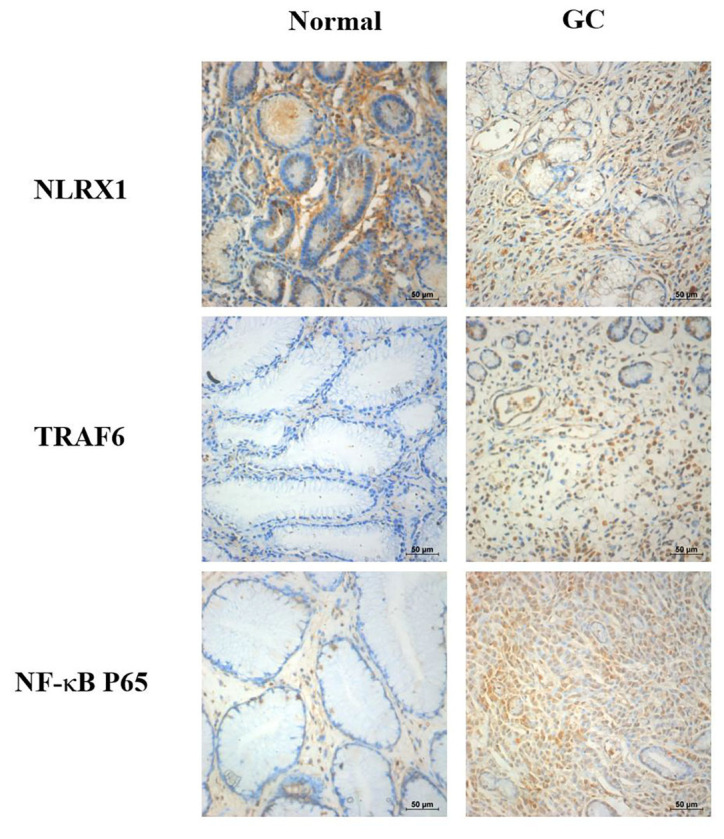
Figure 1.

NLRX1, TRAF6 and NF-κB protein expression levels based on immunohistochemical assays. NLRX1 expression levels in the GC tissues were downregulated, while TRAF6 and NF-κB expression levels were upregulated in the GC tissues compared with the normal tissues. Scale bar, 50 µm. NLRX1, NOD-like receptor X1; TRAF6, tumor necrosis factor receptor-associated factor 6; GC, gastric cancer.
