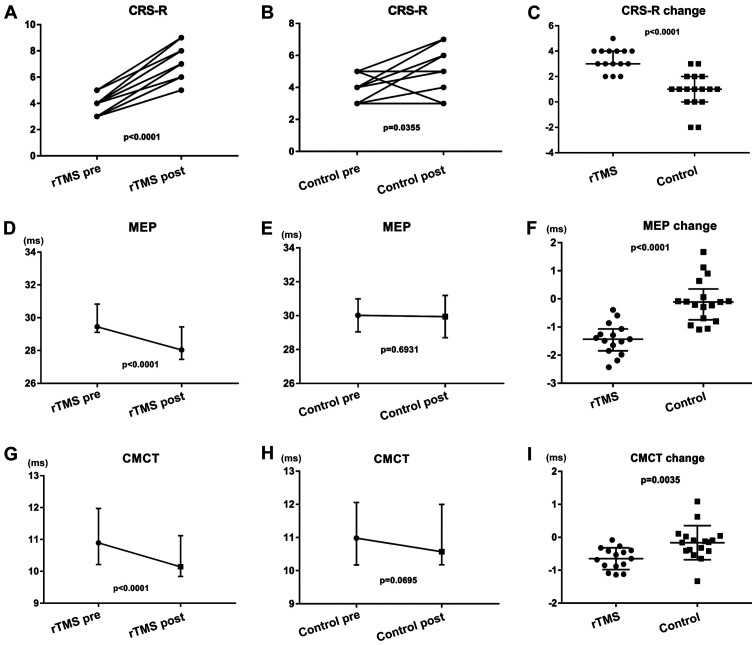
Figure 3.
Data following 20 days of treatment for the rTMS and control groups. (A) A significant increase in the CRS-R scores compared with pretreatment in the (A) rTMS and (B) control groups. (C) The changes in CRS-R scores between the two groups were statistically significant. (D) A significant decrease in the MEP of the rTMS group compared with pretreatment. (E) No significant decrease in the MEP of the control group compared with pretreatment. (F) The changes in MEP between the two groups were statistically significant. (G) A significant decrease in the CMCT of the rTMS group compared with pretreatment. (H) No significant decrease in the CMCT of the control group compared with pretreatment. (I) The changes in CMCT between the two groups were statistically significant. CRS-R, JFK Coma Recovery Scale-Revised; MEP, motor evoked potentials; CMCT, central motor conduction time; rTMS, repetitive transcranial magnetic stimulation; pre, prior to treatment; post, after treatment; ms, milliseconds.

