Fig. 1.
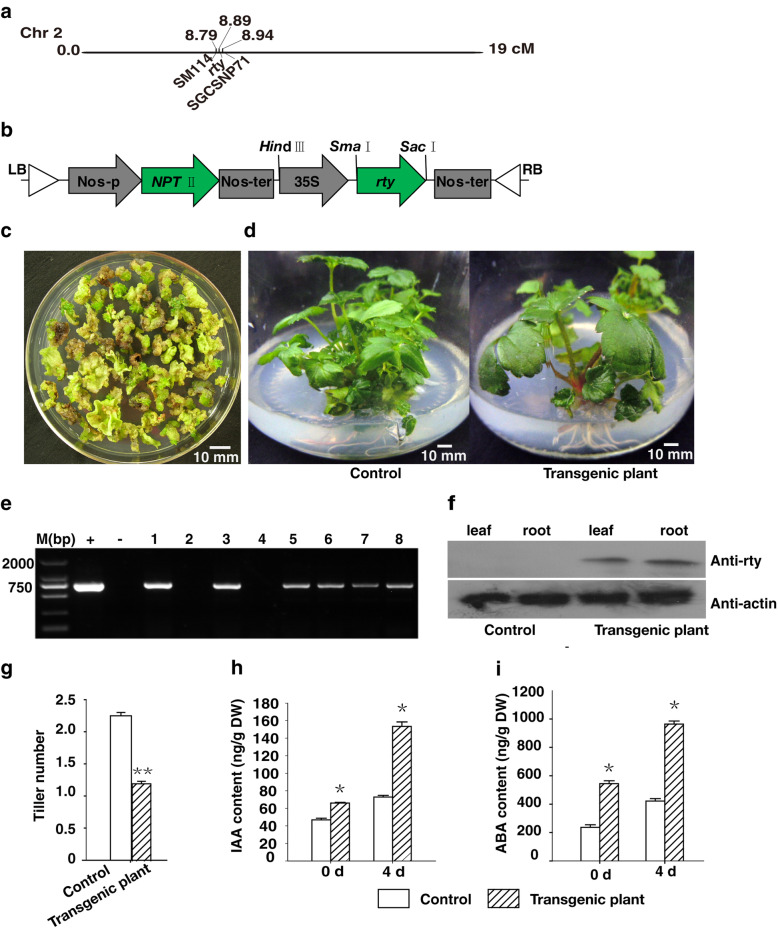
Heterologous expression of rty in strawberry increased endogenous IAA and ABA contents. a Arabidopsis rty is located at position 8.89 cM of chromosome 2. b Schematic diagram of the pBI121-rty vector construct used to transform strawberry. c Resistant shoots were detected on the medium MS + 6 - BA 3.0 mg L− 1 + 2, 4 - D 0.1 mg L− 1 + kanamycin 5 mg L− 1. d Comparison of the control and transgenic plants heterologously expressing rty. e Transgenic plants were analyzed by PCR. 1–8 represented various transgenic plants, whereas + (positive control) represented the pBI121-rty plasmid and - represented the untransformed plant (negative control). M (bp) represented DNA marker (base pair). Full-length gels image is presented in Additional file 2. f Transgenic plants were further analyzed by western blot with anti-rty and anti-actin. Full-length blots images are presented in Additional files 3 and 4. g Tiller number of the control and transgenic plants. Data are presented as the mean ± SD (n = 15) (**P < 0.01, Student’s t test). The endogenous IAA h and ABA (i) contents of the control and transgenic plants were analyzed at days 0 and 4. One month old control and transgenic plants were inoculated on MS medium 4 days with no exogenous growth regulators. The first day were defined the 0 day after inoculating on the medium. About 0.4 cm basic segments of control and transgenic plant at 0 day and 4 days were sampled. Data were presented as the mean ± SD (n = 3) (*P < 0.05, Student’s t test)

