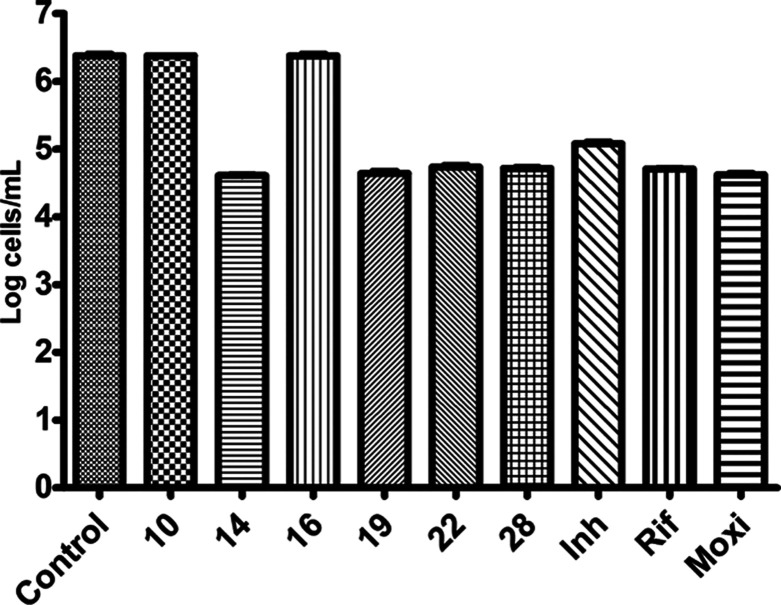
Figure 3.
Activity profiles of some of the lead compounds (10, 14, 16, 19, 22, and 28) and known first-line TB drugs using the nutrient starvation model (NSM) model. The most probable number assay method was used to estimate the bacterial count, and the connotation plot was generated by adopting two-way ANOVA equations (p < 0.0001, using Graph-Pad prism software).

