Figure 6.

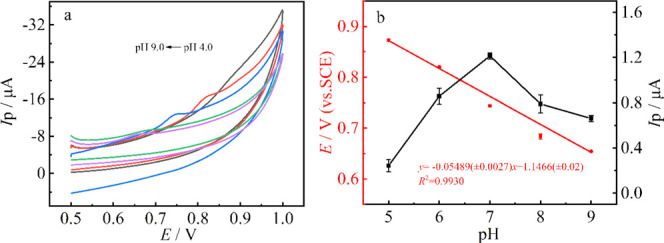
(a) Cyclic voltammetry response of 1 μmol·L–1 MBC in the pH range of 5.0–9.0 at the MoS2 QDs@MWCNTs/GCE. (b) Influence of pH on the peak.

(a) Cyclic voltammetry response of 1 μmol·L–1 MBC in the pH range of 5.0–9.0 at the MoS2 QDs@MWCNTs/GCE. (b) Influence of pH on the peak.