
Figure A.9.
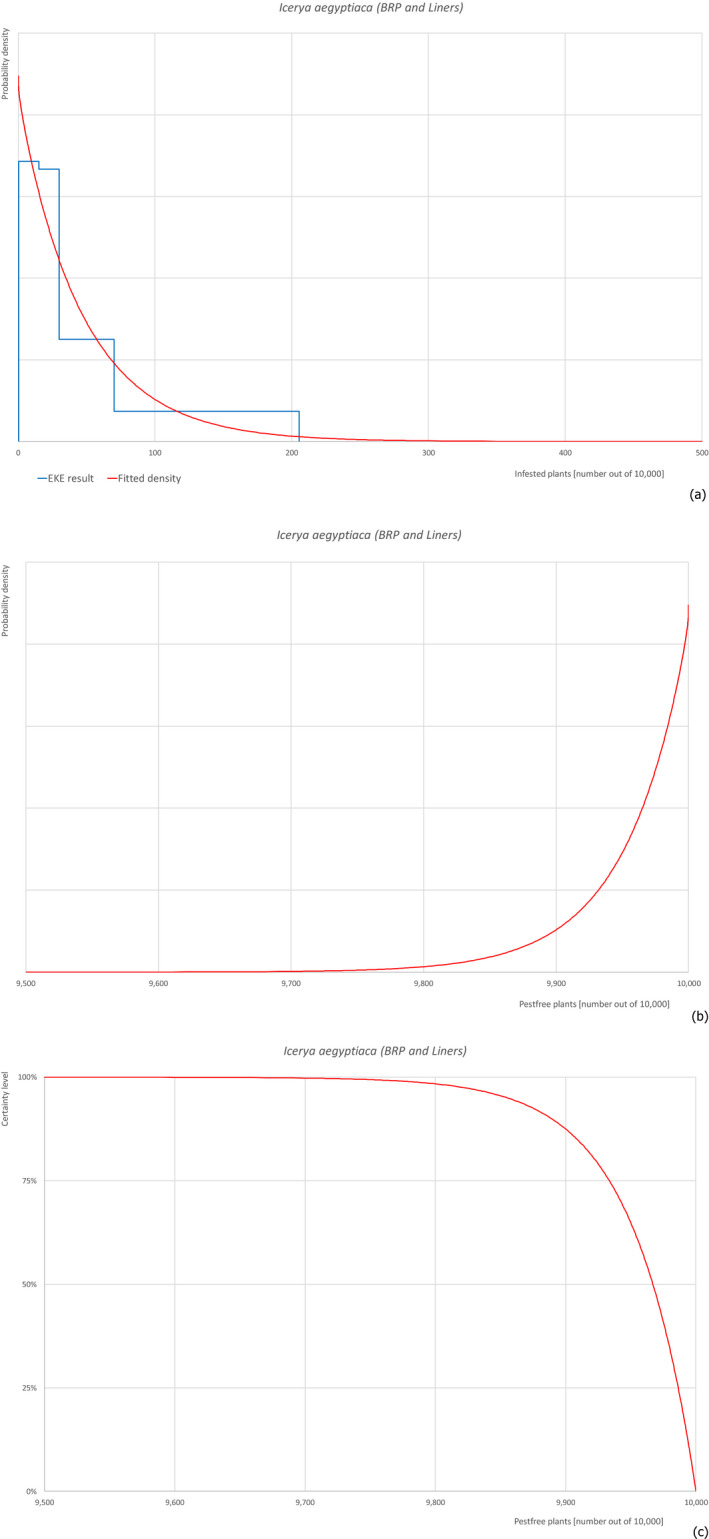
(a) Comparison of judged values for the uncertainty distribution of pest infestation per 10,000 plants (histogram in blue) and fitted distribution (red line); (b) density function to describe the uncertainties of the likelihood of pest freedom; (c) descending distribution function of the likelihood of pest freedom