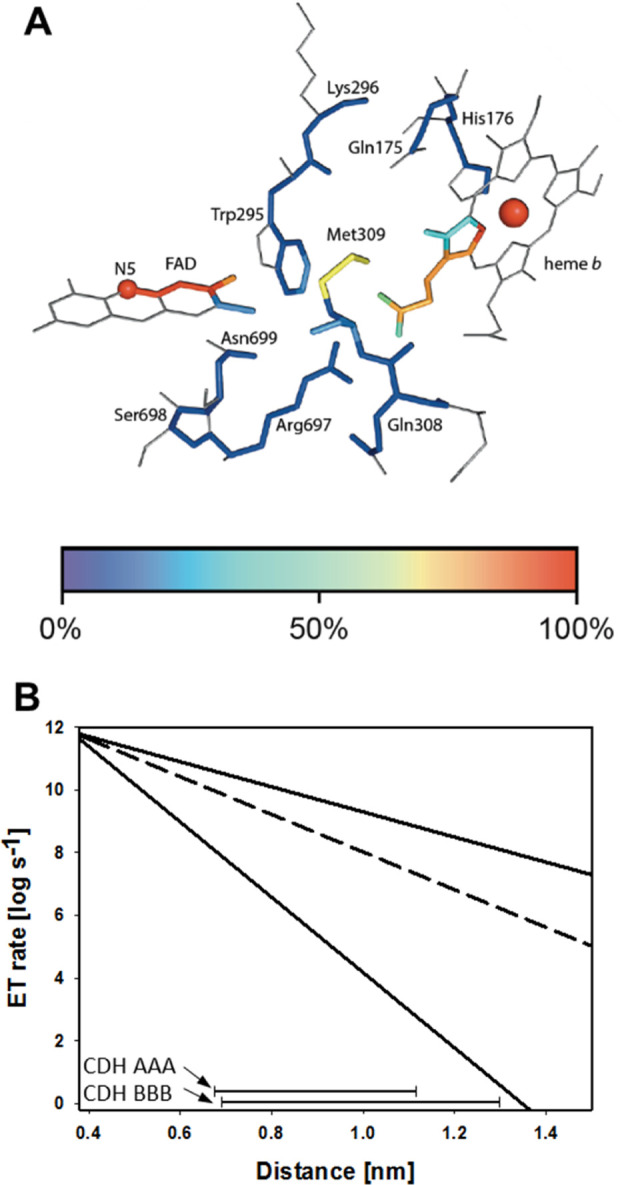
Figure 4.

Electron transfer in CDH (IDET). (A) Detail of the crystal structure of MtCDHIIA (PDB: 4QI6) featuring the closed-state conformation. The edge-to-edge distance between the FAD and heme cofactors is 0.9 nm. (B) Electron transfer rate plotted against cofactor distance for CDH (lower and upper limit, solid lines; most probable parameters, dashed line). The bars at the bottom indicate the observed IDET rates and edge-to-edge distances for CDHAAA and CDHBBB in docking calculations.
