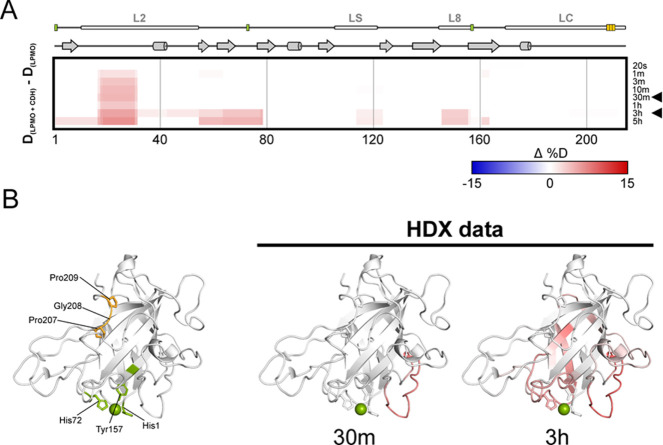
Figure 6.
Structure dynamics arising from N. crassa LPMO9F and CDHAAA interaction detected by H/D exchange. Structural differences between free LPMO and LPMO in the presence of CDHAAA were visualized using a difference heat map (A) (http://peterslab.org/MSTools/). Deuteration levels of the protein alone were subtracted from those observed for the protein in the presence of CDHAAA. Increased deuteration (deprotection) upon interaction is shown by red colors while protection is in blue (scale bar is at the bottom of the panel). Secondary structure elements, loops, and copper coordinating residues (green) and ProGlyPro patch (orange) are depicted above the heat map. Individual exchange times are shown on the right. Two selected time points (30 min and 3 h, indicated by arrowhead) were visualized on the LPMO structure (PDB ID: 4QI8) (B). The coloring scale follows the one in panel A. The central copper atom is shown in green and the side chains of the histidine brace residues and Pro-Gly-Pro patch are shown as sticks. The structure on the left visualizes histidine brace (green) and Pro-Gly-Pro patch (orange) residues.

