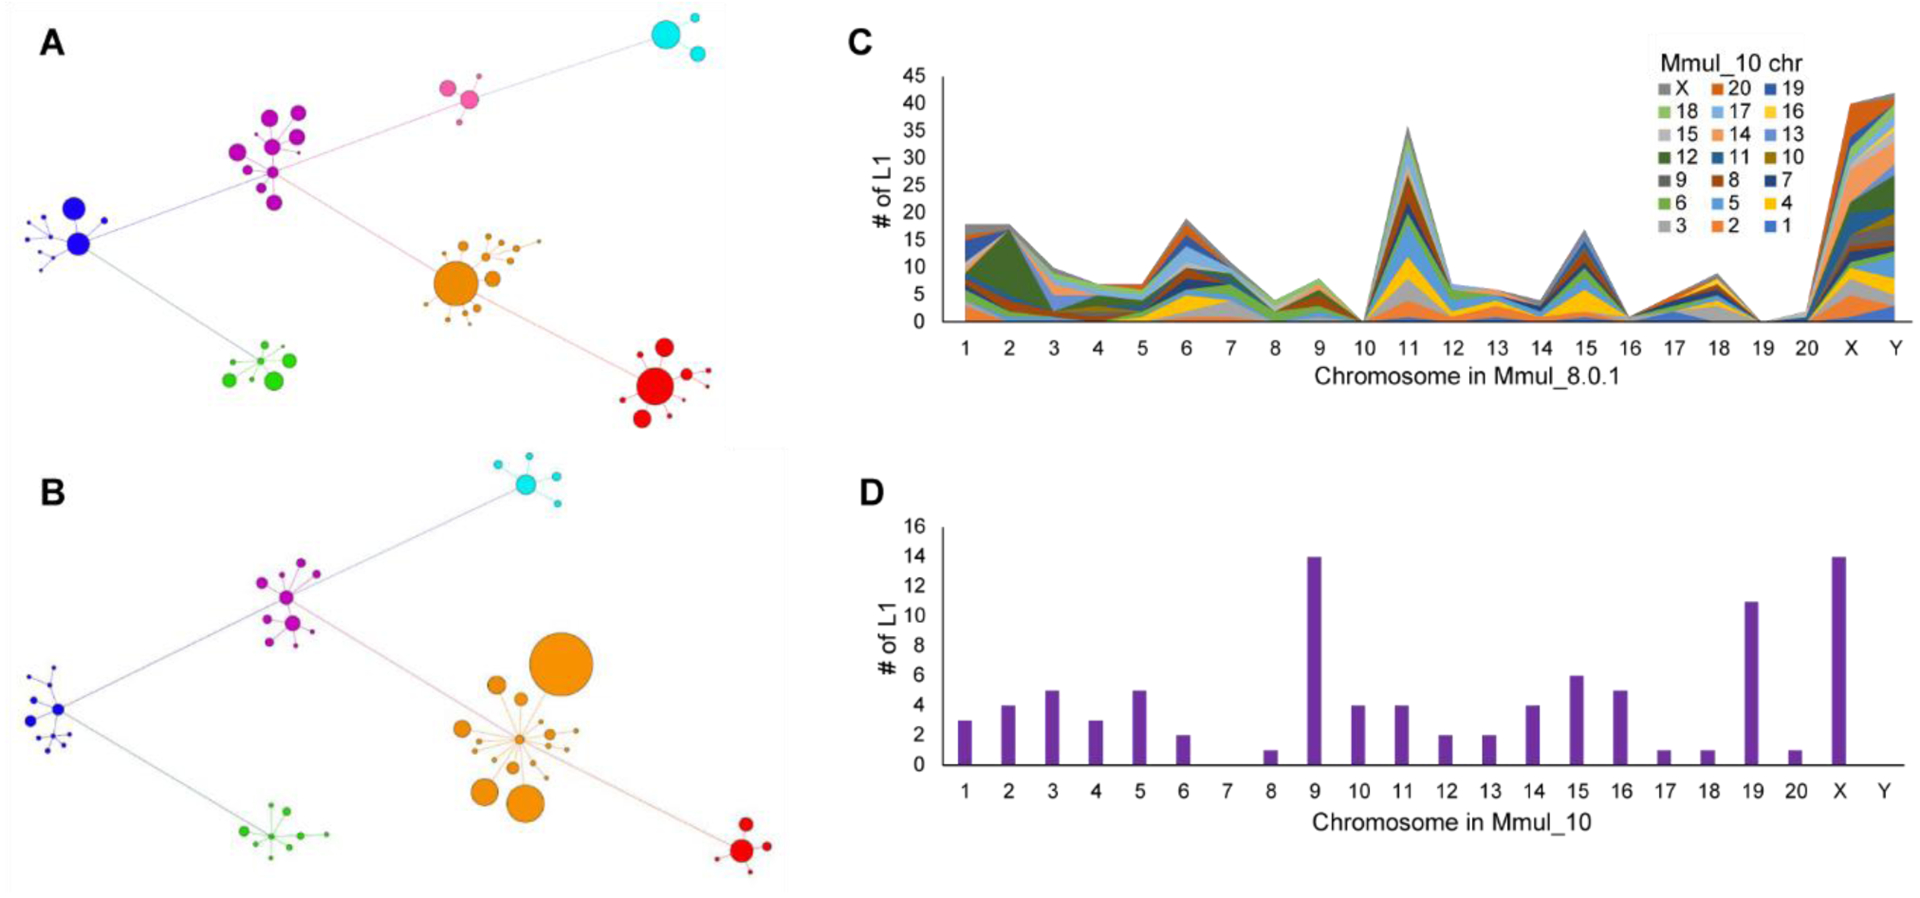
Figure 4. Full-length LINE1 analyses.

A LINE1 subfamily network analysis comparing (A) an earlier macaque assembly, Mmul_8.0.1 (61 subfamilies), to (B) the new assembly, Mmul_10 (58 subfamilies) (18). Related subfamilies are connected by lines and clustered by color: L1RS37 (purple), L1PA7/8 (blue), L1PA6 (green), L1RS36 (pink), L1RS2 (red), L1RS10/16/21 (orange), and L1RS25 (teal). The size of each node corresponds to the relative number of LINE1 elements. There is an increase in annotated younger elements (orange) although the number of subfamilies has decreased the L1RS36 cluster as a result of reassignment based on a higher-quality assembly. (C) The plot depicts the number of full-length L1 elements (y-axis) that have been assigned to a new chromosome in Mmul_10 (key) when compared to Mmul_8.0.1 (x-axis). (D) A similar analysis depicting the number of full-length LINE1 elements previously unplaced (n = 92) but now assigned to a chromosomal location in Mmul_10.
