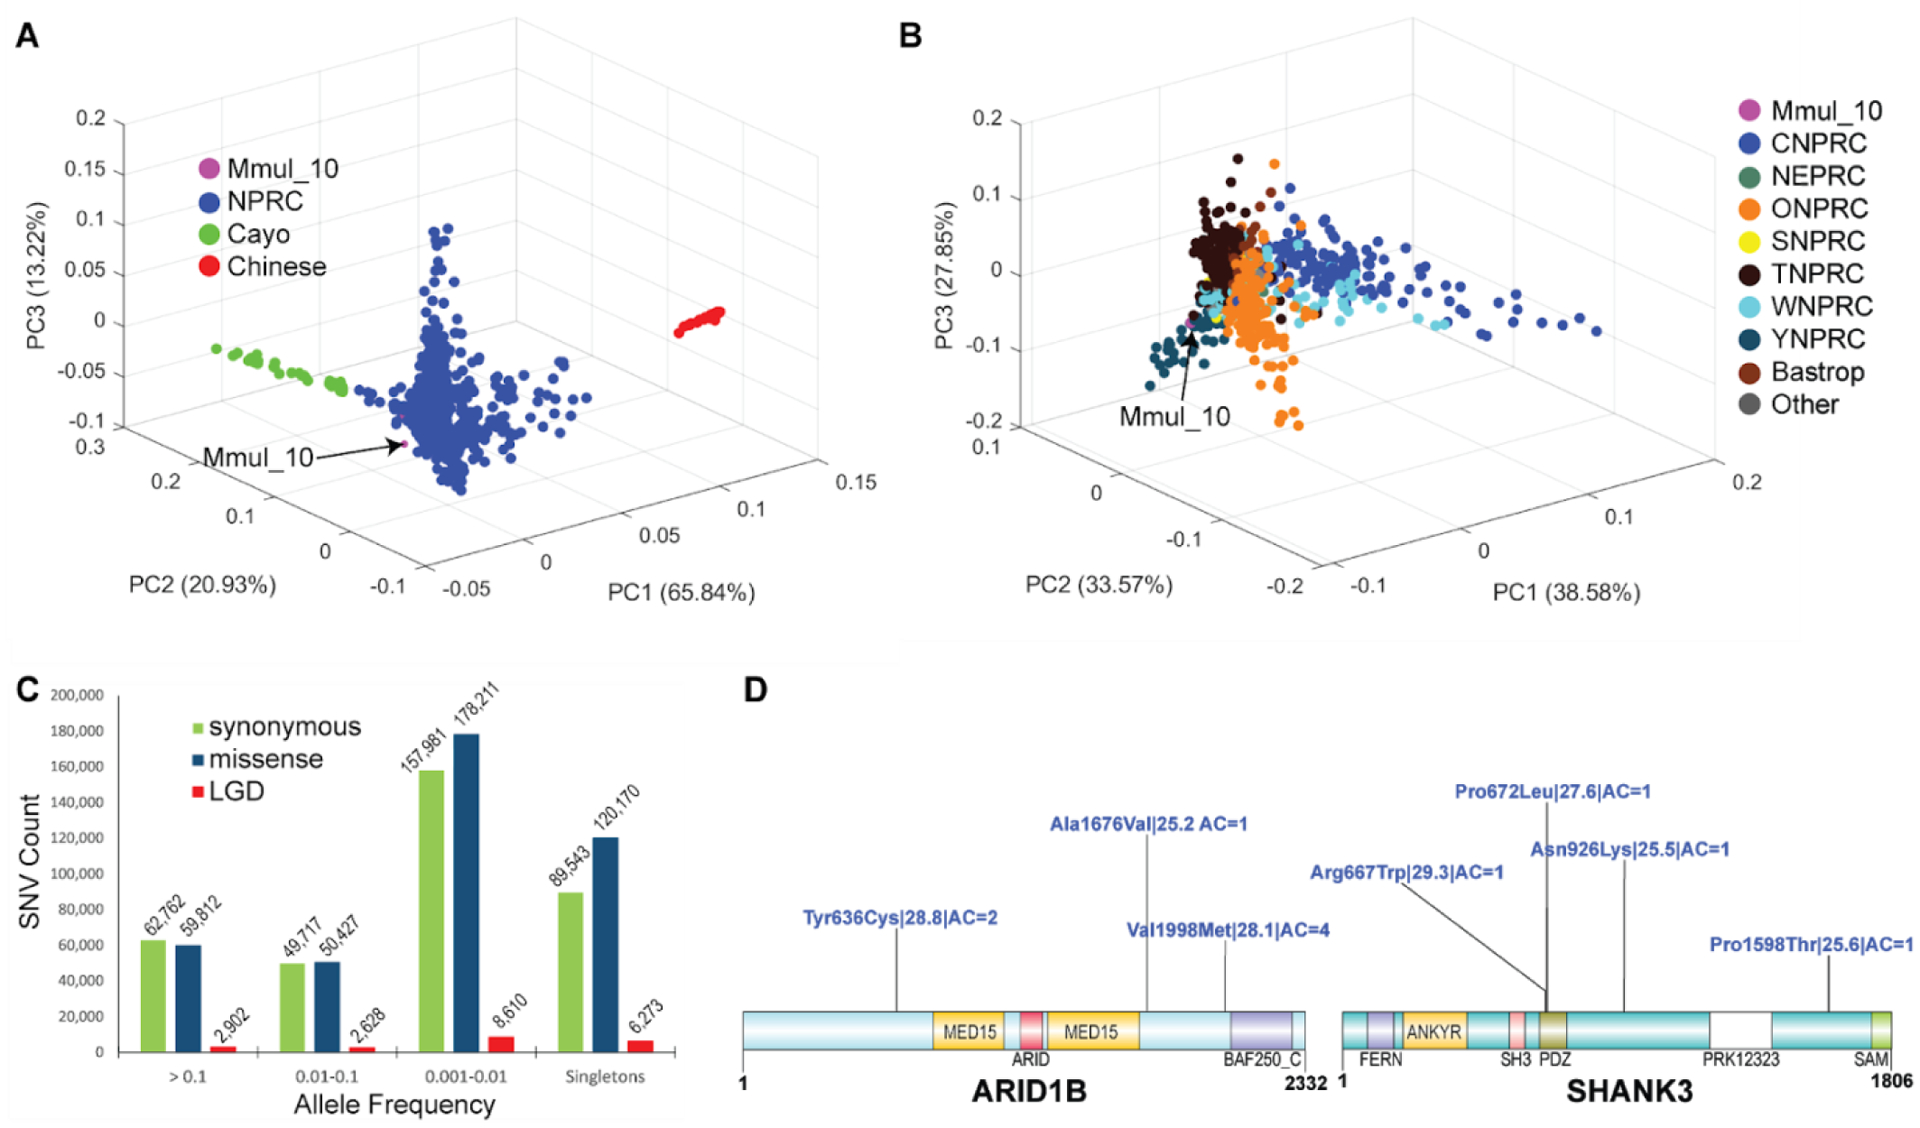
Figure 6. Rhesus macaque population structure and developing macaque models of disease.

(A) A 3D principal component analysis (PCA) based of SNVs filtered for missing call rates > 0.05 or major allele frequency (MAF) < 0.1 from sequencing 853 macaque genomes shows clear separation of Chinese (PC1) genomes (red) and a gradient for Cayo macaques (green) with respect to other Indian macaques (PC2). (B) A PCA excluding Chinese and Cayo populations comparing 771 macaques from different NPRCs. The Cattell–Nelson–Gorsuch (CNG) screen test retained the top three principal components in both PCAs and the percent variance explained calculations are based on those three components. (C) Allele frequency distribution of likely gene-disruptive (LGD) including splice acceptor, splice donor, stop gained, stop loss and start loss variants (red) and missense (blue) variants compared to synonymous changes (green). (D) Genes implicated in human neurodevelopmental disorders (NDDs) showing naturally occurring putatively damaging variants in macaque orthologs. A schematic of damaging missense (blue) variants (CADD >= 25) for NDD genes: MBD5, ARID1B, and SHANK3. For each variant, we indicate the amino acid change| CADD score| allele count. All potentially deleterious mutations are low frequency.
