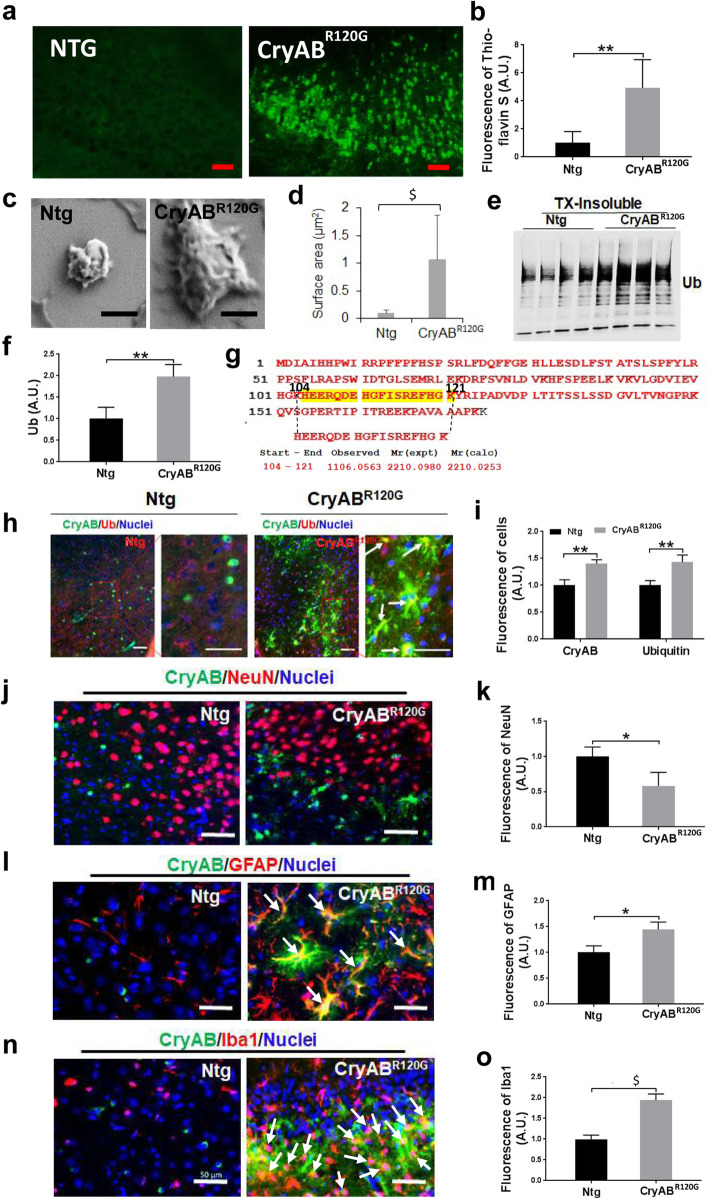
Fig. 3.
Cardiomyocyte-restricted expression of misfolded CryABR120G protein enhanced I/R-induced protein aggregation in the brain. a Thioflavin S staining of the cortical peri-infarct zone of mouse brain at day 7 following MCAO. Scale bar, 50 μm. b Quantitative analysis of (a). c Insoluble protein aggregates from mouse brains were analyzed with a scanning electron microscope. Scale bar, 500 nm. d Measured protein aggregate size. e Western blot analysis of ubiquitin (Ub) protein level from the Triton X100-insoluble CryAB proteins in the brain of mice after MCAO. f Quantitative analysis of (e). g Tandem mass spectrometric analysis of the protein aggregates isolated from the CryABR120G brains following I/R indicate that they contain the mutant CryABR120G protein. h Co-localization of (poly) ubiquitin and CryAB in the brain (peri-infarct, cortex) of mice after MCAO. Scale bar, 50 μm. i Quantitative analysis of (h). j Co-staining of NeuN and CryAB in the brain of mice after MCAO. Scale bar, 50 μm. k Quantitative analysis of (j). l Co-staining of GFAP and CryAB in the brain of mice after MCAO. Arrows, showing colocalization of GFAP with CryAB as indicated by yellow color. Scale bar, 50 μm. m Quantitative analysis of (l). n Co-staining of Iba1and CryAB in the brain of mice after MCAO. Arrows, showing colocalization of Iba1 with CryAB as indicated by yellow in color. Scale bar, 50 μm. o Quantitative analysis of (n). For immunostaining, 10–15 sections per animal were imaged and analyzed with the ImageJ software. Numerical data are shown as mean ± SD; n = 3 or 4. * p < 0.05, **p < 0.01, $p < 0.001

