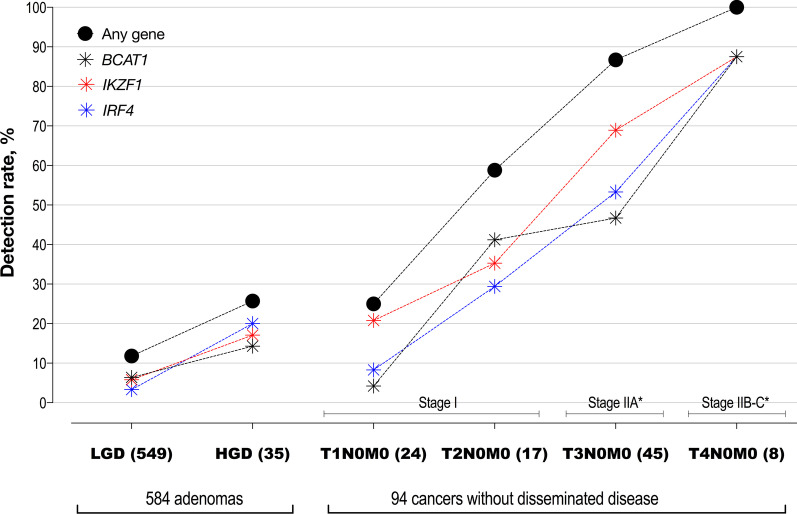
Fig. 2.
Positivity by progression of cellular atypia (dysplasia in adenomas) and degree of invasion (T stage in cancer), in cases without disseminated disease. LGD low grade dysplasia, HGD high grade dysplasia. Y axis: average detection rates, % (sensitivity). Closed black circles—at least one PCR replicate positive for methylation in any of the three genes; blue, red and black symbols—detection rates of the individual methylation markers, IRF4, IKZF1 and BCAT1, respectively. Additional file 1: Table S1 provides details for count of positives, % detected and 95% CI. *Only 53 of the 57 Stage II cases had full TNM information

