
Figure 5.
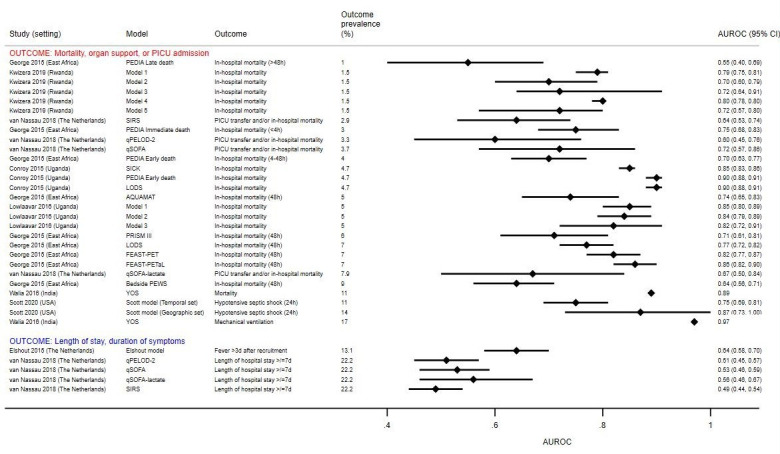
Discrimination of clinical prediction models to identify children at risk of severe disease. Individual studies evaluated different clinical prediction models using datasets with varying numbers of children with severe disease, depending on the data available. The outcome prevalence reflects the proportion of children with severe disease in the dataset used to evaluate that particular prediction model/outcome pair. This may be different from the overall prevalence of children with severe disease in the study, which is listed in table 1 and used to classify studies into low, moderate or high prevalence settings. No CIs were provided for the AUROC estimates in the study by Walia et al. AQUAMAT, African Quinine Artesunate Malaria Trial; AUROC, area under the receiver operating characteristic curve; FEAST-PET, FEAST-Paediatric Emergency Triage; FEAST-PETaL, FEAST-Paediatric Emergency Triage and Laboratory; LODS, Lambaréné Organ Dysfunction Score; PEDIA, Paediatric Early Death Index for Africa; PEWS, Paediatric Early Warning Score; PICU, paediatric intensive care unit; PRISM III, Paediatric Risk of Mortality; qPELOD-2, quick Paediatric Logistic Organ Dysfunction; qSOFA, quick Sequential Organ Failure Assessment; SICK, Signs of Inflammation in Children that Kill; SIRS, Systemic Inflammatory Response Syndrome; YOS, Yale Observation Score.