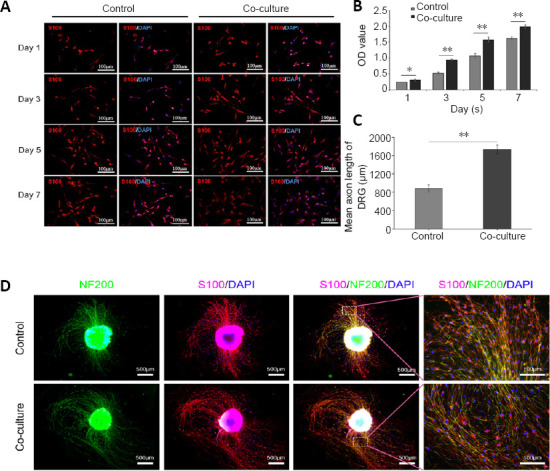
Figure 3.

The proliferation of SCs and DRGs after co-culture with nerve microtissue.
(A) SCs and nerve microtissues were cultured together for different periods of time. The proliferation rate of SCs was greater in co-culture than in single culture. S100 expression is in red (Alexa Fluor-594). (B) Cell counting kit-8 proliferation assay also showed that the SC proliferation rate increased when co-cultured with nerve microtissue (global P < 0.05; n = 3 independently repeated assays per group). (C, D) After 7 days of co-culture of DRGs and nerve microtissue, the axon lengths of the nerve microtissue was greater compared with single culture (P < 0.01; n = 3 independently repeated assays per group). S100 expression is in red (Alexa Fluor-594), and NF200 expression is in green (Alexa Fluor-488). Scale bars: 100 μm in A and D right column, 500 μm in D other columns. Data are expressed as the mean ± SD. *P < 0.05, **P < 0.01 (Student’s t-test). DAPI: 4′,6-Diamidino-2-phenylindole; DRG: dorsal root ganglion; NF200: neurofilament 200; OD: optical density; SCs: Schwann cells.
