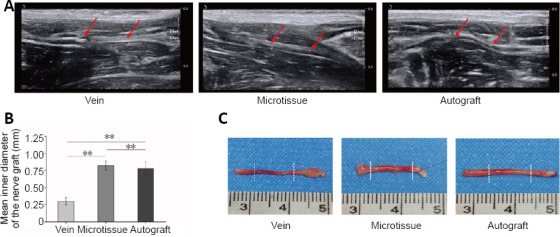
Figure 4.

Ultrasound examination and gross appearance of the sciatic nerve at 12 weeks after surgery.
(A) Using ultrasonic examination of nerve graft, it was found that nerve continuity was good in all three groups, and no edema was observed around the nerve. However, it was smaller in diameter in the vein group compared with the microtissue and autograft groups. The junction (red arrows) at both ends of the graft can be seen under ultrasonic examination. (B) The mean inner diameter of the nerve graft in each group (n = 8 rats per group). Data are expressed as the mean ± SD. **P < 0.01 (one-way analysis of variance followed by Tukey’s post hoc test). (C) The gross morphology of the sciatic nerve in each group. Similar to the ultrasound results, the diameter of nerve grafts in the vein group was smaller than that in the microtissue group and the autograft group. The two stumps of the nerve graft, indicated by the white dashed lines, are shown in the general view.
