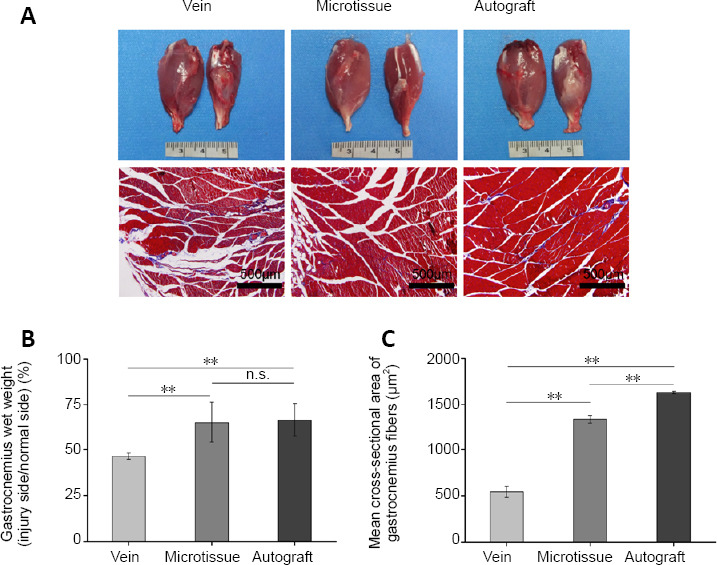
Figure 9.

Gastrocnemius muscle weight ratio in rats with vein/nerve microtissue hybrid scaffold graft at 12 weeks post-surgery.
(A) The general view and Masson staining of the gastrocnemius muscle. The left gastrocnemius muscle represents the healthy side and the right gastrocnemius muscle represents the operative side. The atrophy of the gastrocnemius muscles on the operative side in the vein group was more severe than in the other groups. Masson staining showed that the muscle fiber area of the Vein group was also smaller than that of the other groups. Scale bars: 500 μm. (B) The gastrocnemius wet weight (n = 8 randomly selected fields per group). (C) The mean cross-sectional area of gastrocnemius fibers (n = 8 randomly selected fields per group). Data are expressed as the mean ± SD. **P < 0.01 (one-way analysis of variance followed by Tukey’s post hoc test).
