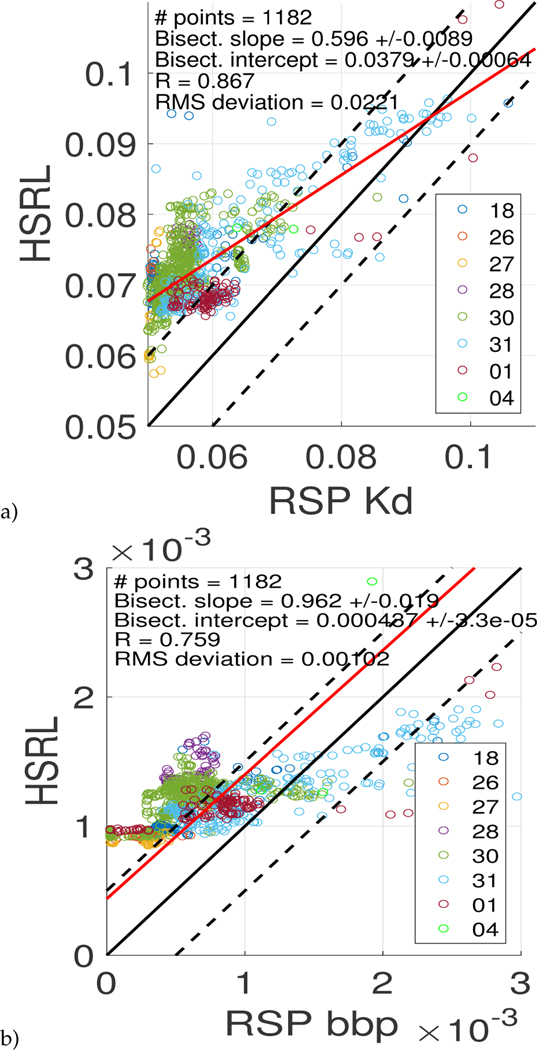
Fig. 11.
SABOR campaign RSP MAPP and HSRL-1 ocean product correlations of a) Kd [m−1] and b) bbp [m−1], both at 532 nm, for all AAO (Aerosol-Above-Ocean) scenes with an ocean bottom greater than 30 m. Each color represents a different day between July 18 to August 4, 2014. The one-to-one line is colored in black, and the dashed black lines represent the desired ± 1σ accuracy. The red line represents the least squares bisector.

