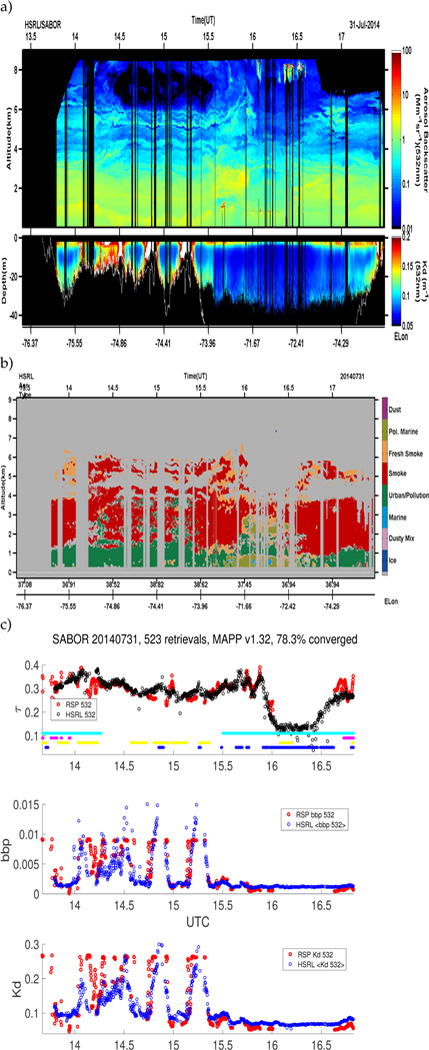
Fig. 3.
SABOR July 31, 2014 flight. a) HSRL-1 atmosphere backscattering coefficient and ocean diffuse attenuation coefficient. b) HSRL-1 aerosol typing algorithm, where we can see that the aerosol structure for this day is complex with multiple layers and a lofted smoke plume. c) The atmosphere/ocean results from RSP MAPP and HSRL for this entire day. The following masks are also displayed, where the color indicates the presence of: clouds-above-aircraft (cyan), aircraft not at cruising altitude (magenta), aircraft turns/course corrections (yellow), and clouds below the aircraft (blue).

