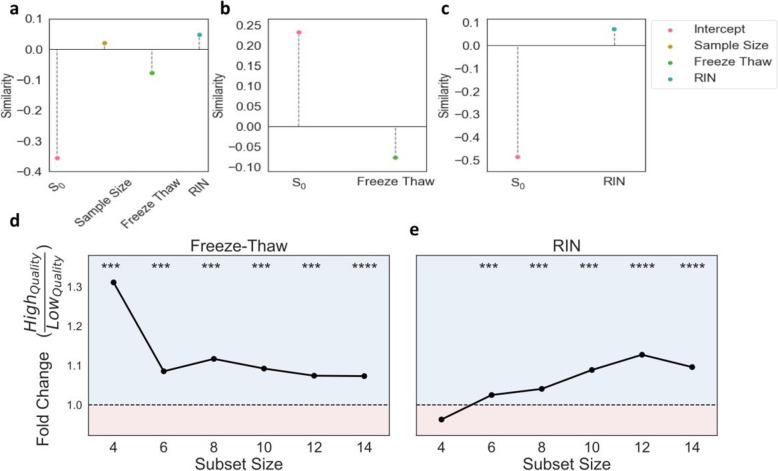
Fig. 4.
Freeze-Thaw and RIN Both Demonstrate Higher Similarity with Increased Quality. Top panels summarize results of linear regressions used to quantify the change in similarity per unit increase in (a) sample size, number of freeze-thaws and RIN combined additively, (b) only the number of freeze-thaws, and (c) only RIN. S0 represents the intercept estimate and sample size, freeze-thaw, and RIN represent coefficient estimates. All estimates are significant. Bottom panels demonstrate fold-change in median similarity of high quality subsets with respect to low quality subsets at each subset size. The region shaded in blue (fold-change > 1) indicates instances where the median similarity for high quality is larger than that of low quality. The region shaded in red (fold-change < 1) indicates instances where the median similarity for low quality is larger than that of high quality. Average (d) freeze-thaw or (e) RIN are used to place subset pairs into high or low quality sample bins. Significance (one-sided Mann-Whitney U test) of comparisons in similarity distributions between high and low quality subset pairs are displayed above each subset size

