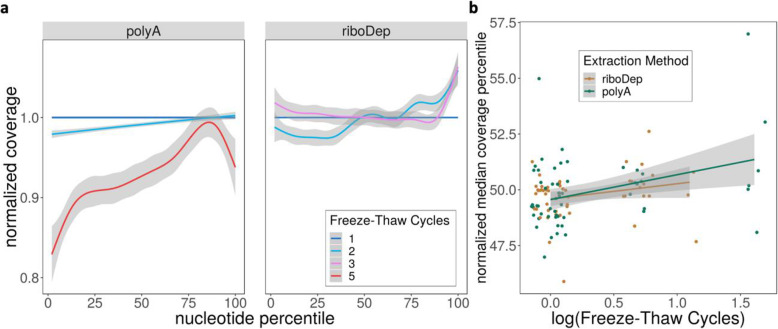
Fig. 6.
Freeze-Thaw Cycles Exacerbate 3′ Bias in poly(A)-enriched samples. a Gene coverage (y-axis) at the ith nucleotide percentile (x-axis) for samples that underwent 1–5 freeze-thaws and were extracted using either poly(A)-enrichment or ribosomal depletion. Coverage is normalized to samples that underwent one freeze-thaw. For each sample, coverage is averaged across all genes; samples are aggregated using generalized additive model smoothing, with shaded regions representing 95% confidence intervals. b Linear model fits comparing the change in normalized median coverage percentile to the number of freeze-thaw cycles (log-transformed) for ribosomal depletion (orange) or poly(A)-enrichment (green)

