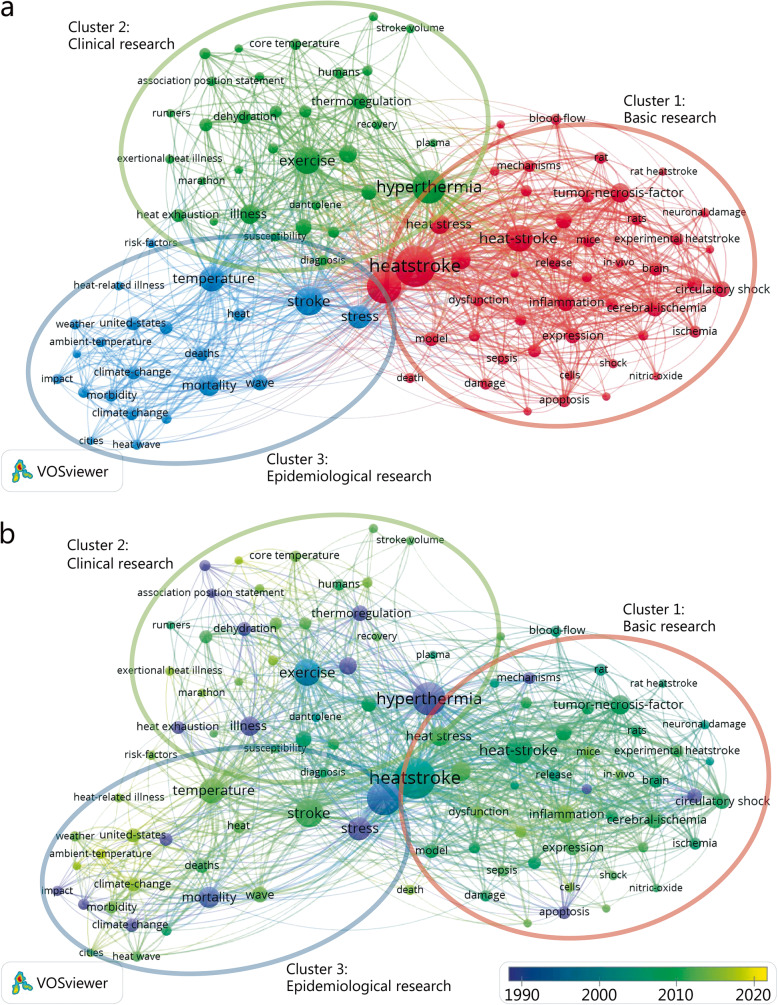
Fig. 4.
The analysis of keywords in publications on HS. a Mapping of the keywords in the area of HS. The words were divided into three clusters in accordance with different colors that were generated by default, specifically, basic research (left in red), clinical research (up in green), and epidemiological research (right in blue). The large icon indicates the keywords that appeared at a high frequency; b The distribution of keywords is presented according to the average time of appearance, with the blue representing an early appearance and the yellow indicating keywords that have appeared more recently. The smaller the distance is between two keywords, the greater the frequency of their co-occurrences

