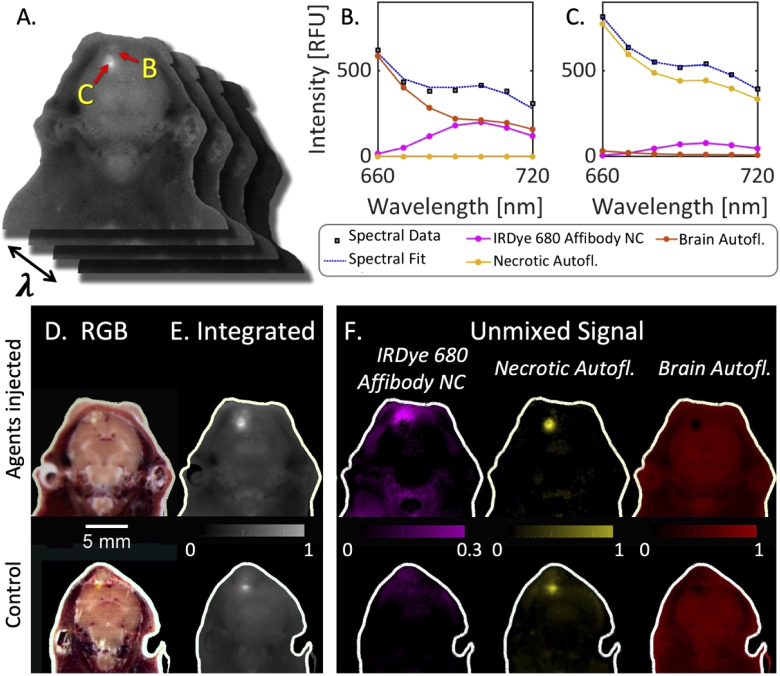
Fig. 5.
(A) Illustration of a hyperspectral image stack acquired with the red excitation channel. (B) and (C) are spectra sampled at two different pixels, one in necrotic tissue (B) and the other in surrounding tumor (C). (D) Single RGB image slice of two mice, one administered the agents, and a non-injected control. (E) Images of the integrated red channel spectrum. (F) Images of the contribution of each basis spectra after spectral unmixing in both the injected and control mice. Both animals had an orthotopic glioma xenograft.

