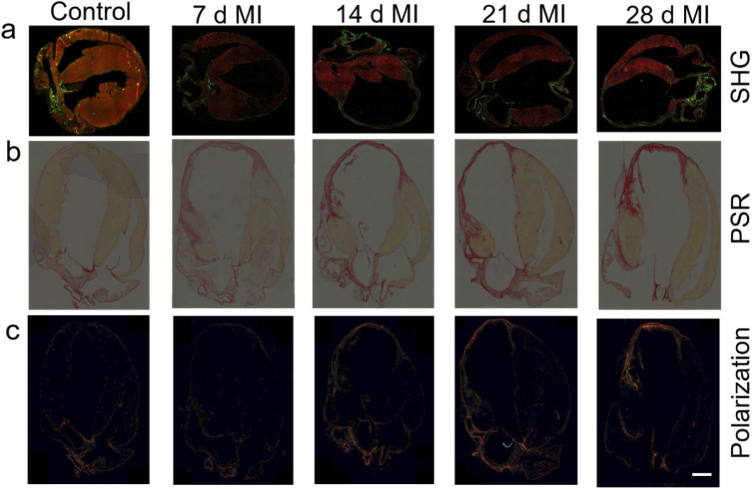
Fig. 1.
Progression of scar formation after MI in the mouse heart. (a) Overlayed SHG (green) and two-photon autofluorescence (red) images at different time points showing the deposition of collagen after MI. 10x, 0.4 NA objective lens was used to capture these images. For comparison, (b) bright field images of the picrosirius red (PSR) stained, and (c) birefringence detection using polarized light for heart tissues collected from the same time points are shown. Scale bar: 500 µm

