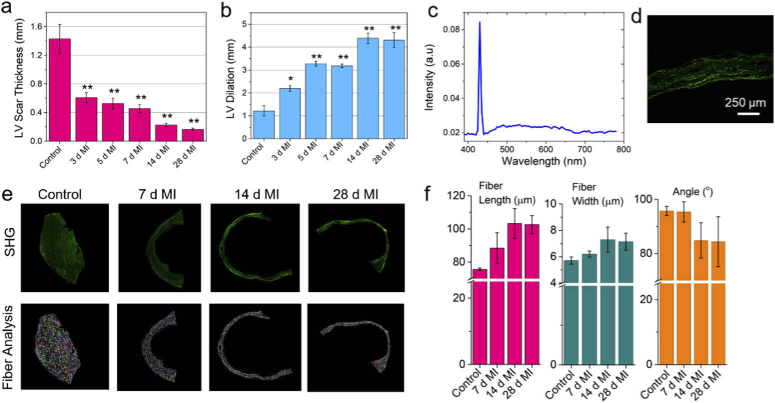
Fig. 2.
Evaluation of MI size and assessment of cardiac fiber characteristics post MI in the left ventricle. (a) Quantification of LV wall thickness at different time points compared to sham (control) group using the SHG images. (b) Assessment of LV dilation with respect to septum at different time points after MI injury using the SHG images. (c) SHG spectrum collected from the scar region post 4 week-MI. (d) The corresponding SHG image of the scar region. (e) Representative SHG image (top panel) of the LV region after 7, 14, and 28 days post MI compared to the sham group. The corresponding cardiac fiber analysis for each image is shown in the bottom panel. (f) The variation of estimated fiber length, fiber width, and fiber inclination angle at different time points post MI using the SHG images acquired using 10x, 0.4 NA objective lens. Scale bar 250 µm. *p < 0.05, **p < 0.001, one-way ANOVA

