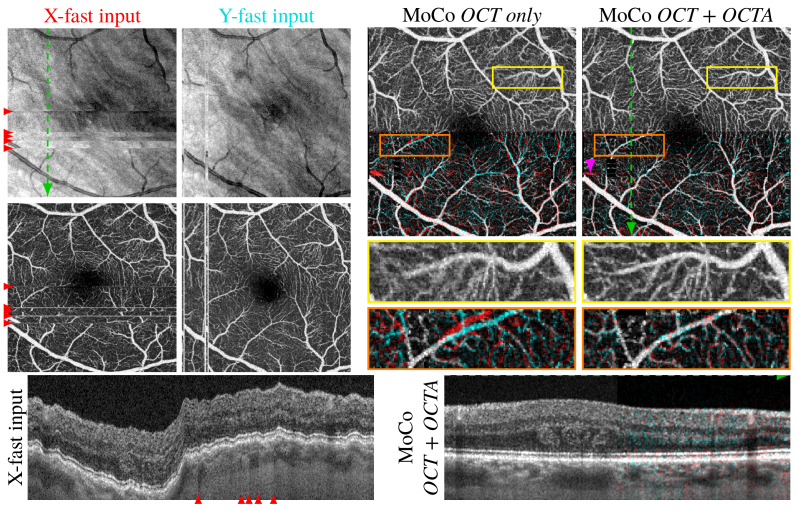
Fig. 8.
Increased sharpness in merged volume data when using OCTA data during motion correction (MoCo) in the 61 y/o NAION subject. The merged images are split vertically and are displayed in regular grayscale in the upper half and in composite color in the lower half. Here, the X-fast scan is displayed in red and the Y-fast scan in cyan. If the contributions from both scans are equal, the colors sum to a gray value. Areas with contribution from only one volume are also colored gray in order to emphasize misalignments. The composite images are median filtered to reduce color from speckle noise, and contrast enhanced to emphasize the structural differences. The OCT B-scans are extracted along the dashed green arrows.

