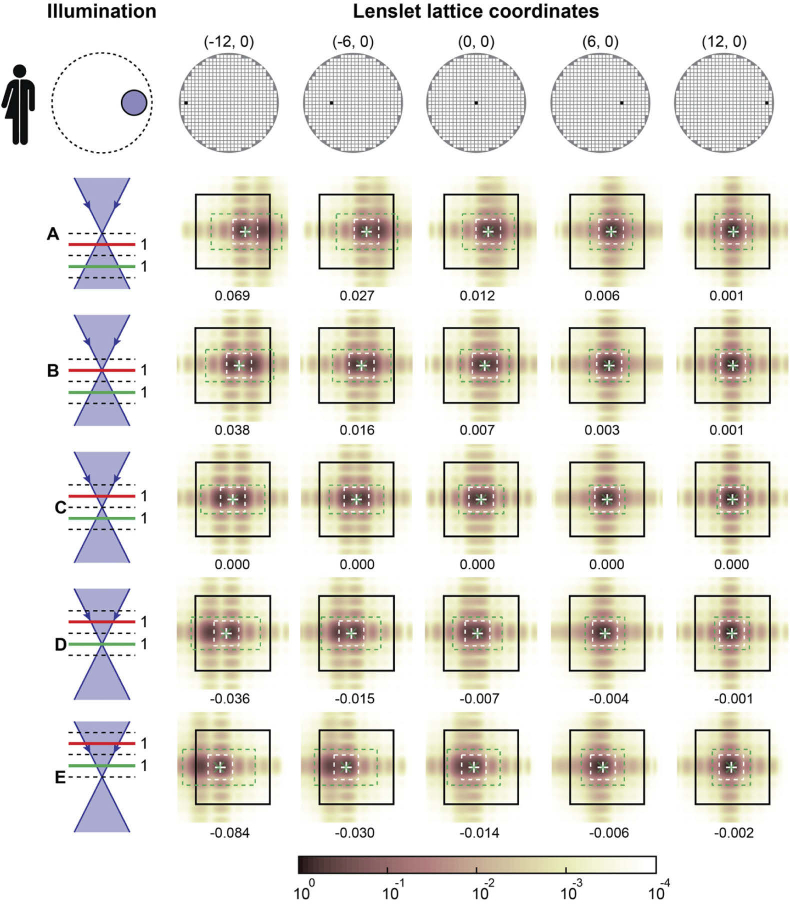
Fig. 16.
SHWS lenslet images calculated for a human eye at various pupil positions (see top row diagrams) using an off-axis small circular pupil and five foci, and assuming beacon originating from the red and green planes with equal amplitude. The images show normalized intensity using the logarithmic color scale indicated by the color bar. The large black solid line squares represent the lenslet outline projected onto the pixelated sensor, while the dashed-line rectangles/squares show the search boxes used in the final centroiding iteration with sizes matching the lenslet central diffraction lobe (white dashed lines) and that provided by Eqs. (6) and (7) (green dashed lines). The estimated centroids are indicated using corresponding green ‘x’ and white ‘+’ markers, and the number below each panel is the difference between centroids estimated with the two marked search boxes, in units of the diffraction-limited first minimum to minimum lobe distance.

