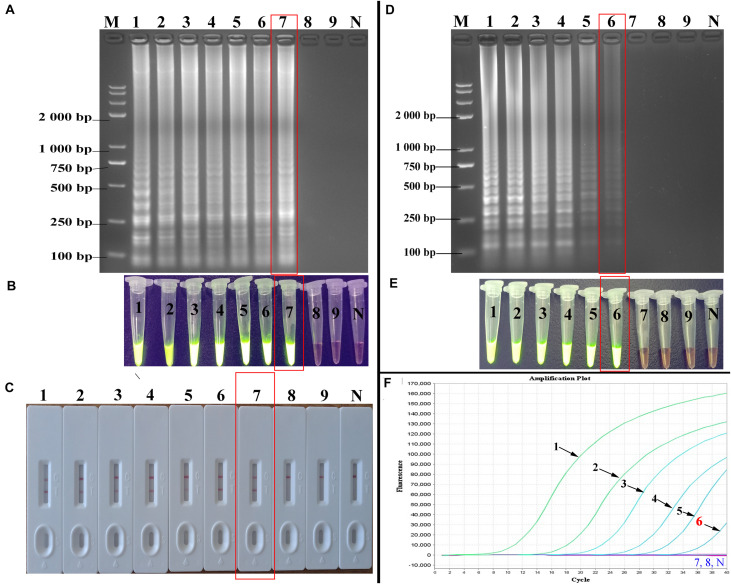
FIGURE 5.
Sensitivity of the PSR-LFB assay for HBV detection. (A–C) Analysis the PSR amplicons by AGE, SGI, and LFB assay, respectively. (D,E) Amplification results of LAMP assay by AGE and SGI method. (F) Detection of HBV by qPCR. M: DNA maker DL8000. Lanes/tubes/biosensors/fluorescence signals 1–9: 5.4 × 10⁶, 5.4 × 10⁵, 5.4 × 10⁴ 5.4 × 10³, 5.4 × 10², 5.4 × 101, 5.4 × 100, 5.4 × 10⁻¹, 5.4 × 10⁻² copies/mL, respectively. N: negative control.

