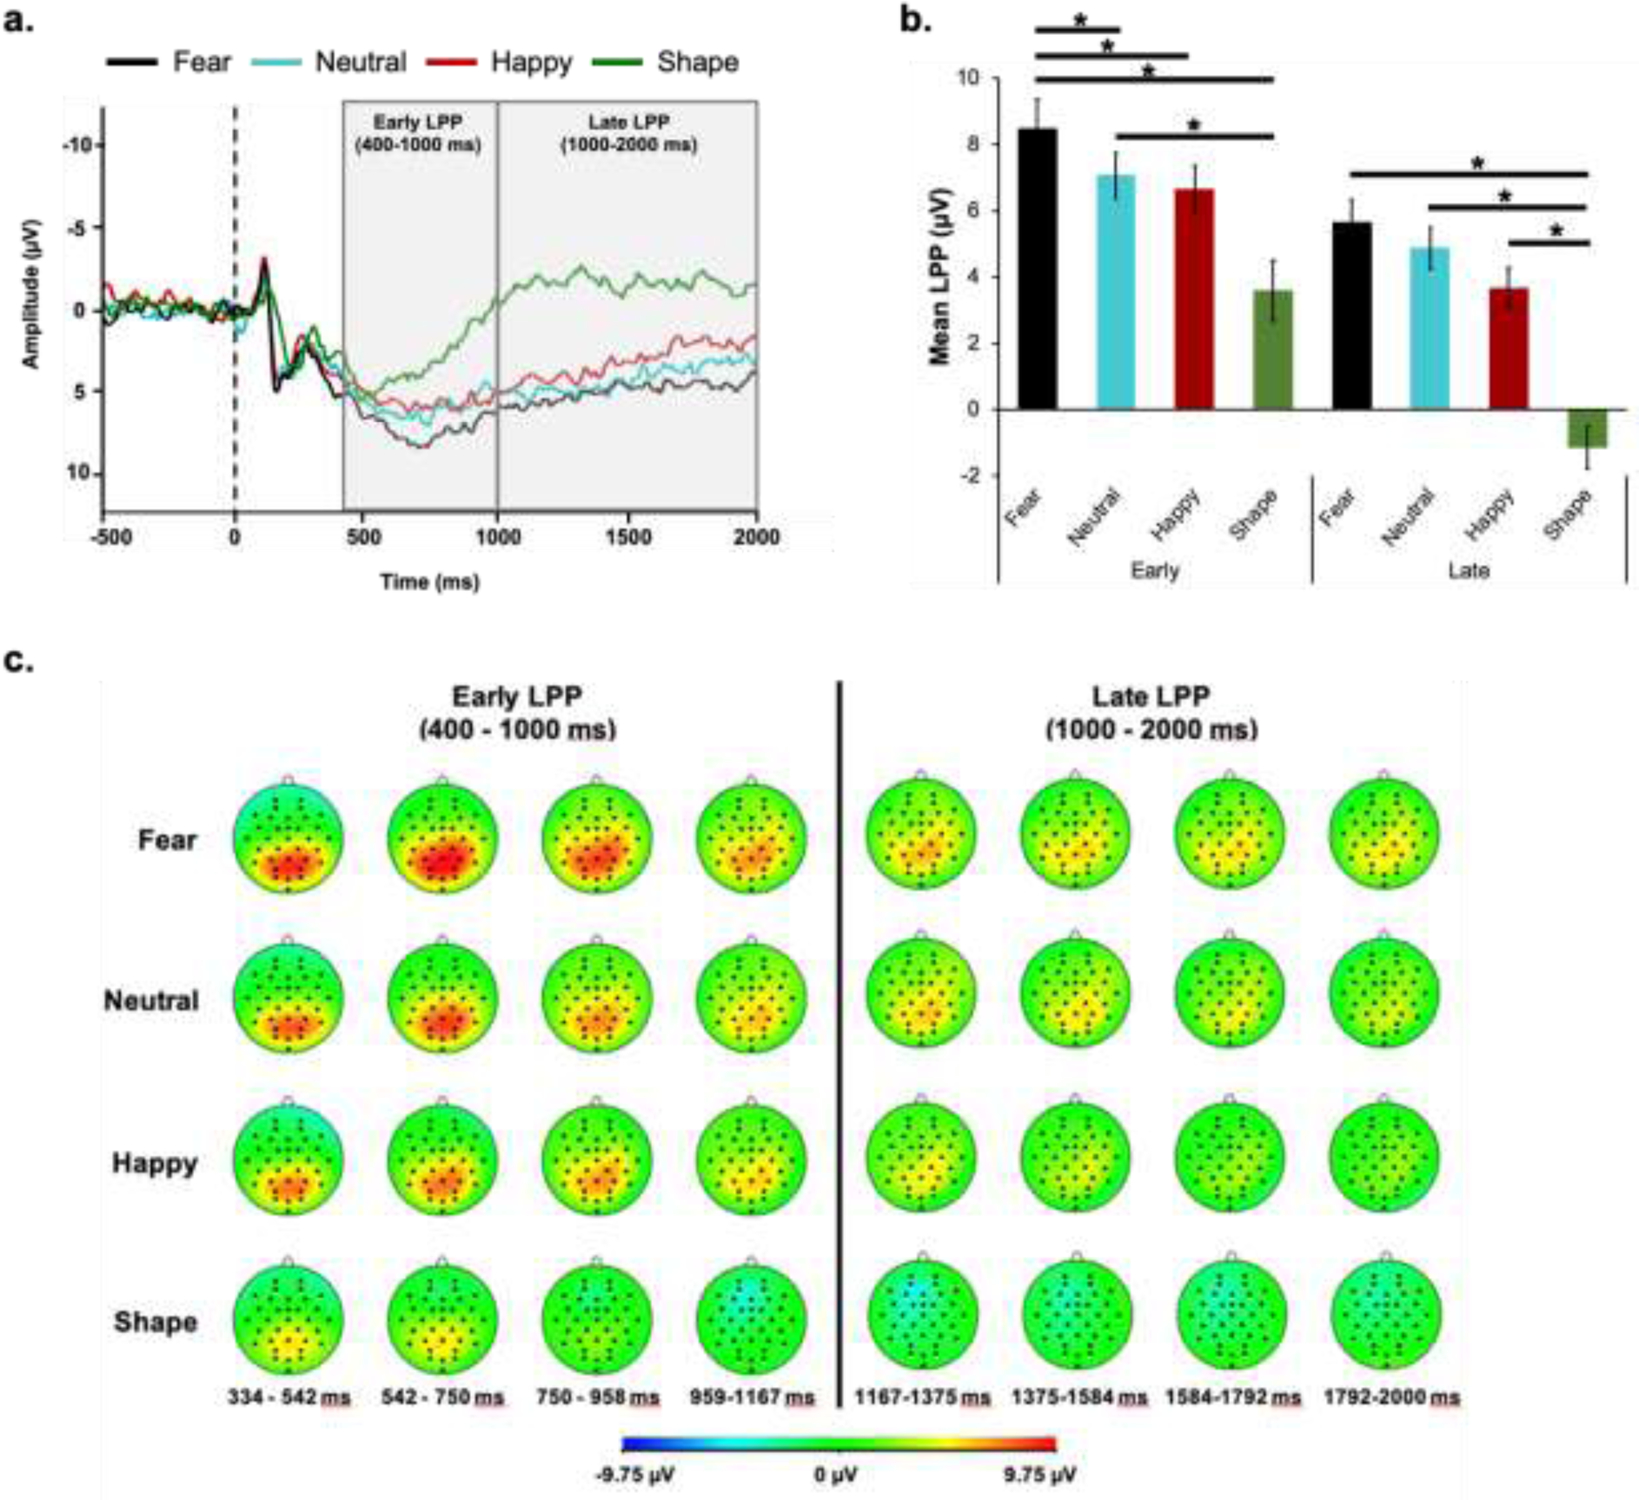
Figure 3.

Late positive potential (LPP) grand-average waveforms for each condition in the emotional faces task (EFAT) (a), mean activity of early and late LPP (b), and head maps depicting the spatial distribution of voltage differences for each condition (c). Of note, the LPP response shown in panel (a) was pooled across four parieto-occipital electrodes, where LPP was shown to be maximal. In addition, positive amplitude is plotted downwards on the y-axis, for panel (a).
