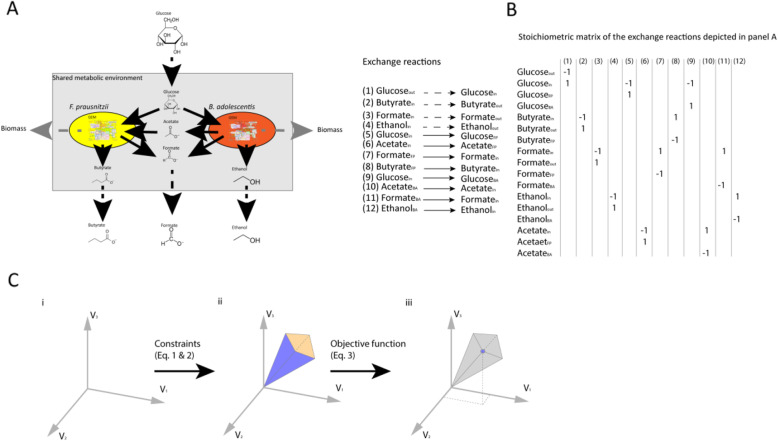
Fig. 1.
Application of flux balance analysis to simulate a metabolic interaction among multiple bacteria. a A metabolic network of a bacterial community consisting of Faecalibacterium prausntizii and Bifidobacterium adolescentis (adapted after El-Semman et al. [20]). Fluxes of the exchange reactions are represented by arrows. Solid black arrows indicate uptake, and secretion reactions of the bacteria, dashed black arrows indicate the flow of metabolites in or out of the system, and dashed grey arrows indicate the formation of new biomass, where metabolites cannot be secreted by the bacteria anymore, thus leaving the system. b Stoichiometric matrix of the exchange reactions depicted in panel a. BA depicts B. adolescentis and FP depicts F. prausnitzii. c Visual representation of the concept of flux balance analysis; (i) A solution space of the flux distribution in a system; (ii) The allowable solution space is the result of addition of constraints depicted in Eqs. 1 and 2, which equations limit the available flux distributions; (iii) Addition of an objective function as depicted in Eq. 3 determines the optimal solution for the flux distribution in the system. Adapted after Orth et al. [3].

