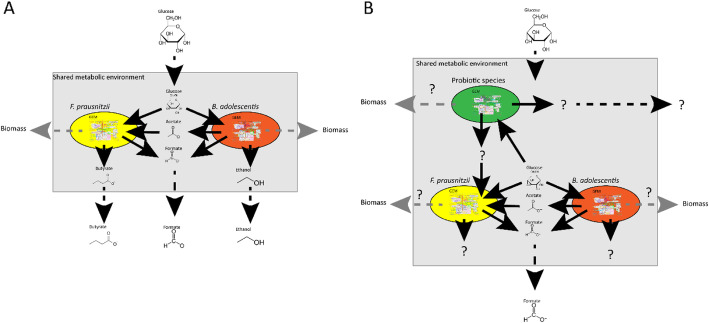
Fig. 6.
Representation of the application of FBA to study the effect of adding probiotic species in a bacterial community consisting of two gut bacteria, F. prausnitzii and B. adolescentis. Fluxes are represented by arrows. Solid black arrows indicate uptake and secretion reactions of the bacteria, dashed black arrows indicate the flow of metabolites in and out of the system and dashed grey arrows indicate the formation of new biomass, where metabolites can no longer be secreted by the bacteria, thus leaving the system. The amount of flux is represented by the thickness of the arrows, a higher flux is a thicker arrow. a The community depicted in Fig. 3Adapted after El-Semman et al. [20]. b Addition of another species to the shared metabolic environment will change the flux distribution of the whole system. The added species might produce a metabolite, which the other species can use, resulting in new products. Similarly, the abundance distribution of the community may change in response to the addition of a new bacterium. A change in abundance distribution of the community is depicted an altered flux through each biomass function

