
Fig. 3.
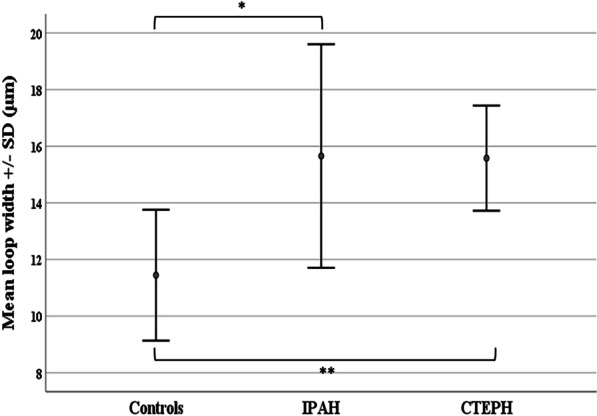
Loop width. Error bars represent the mean loop width ± standard deviation (SD) in healthy controls (11.5 ± 2.3 μm), patients with idiopathic pulmonary arterial hypertension (IPAH) (15.7 ± 3.9 μm) and patients with chronic thromboembolic pulmonary hypertension (CTEPH) (15.8 ± 1.9 μm). Difference in loop width was significant among the three groups (p < 0.001). In detail, patients with IPAH presented significantly increased loop width compared to healthy controls (*p < 0.001). In addition, patients with CTEPH presented increased loop width compared to healthy controls (**p < 0.001)