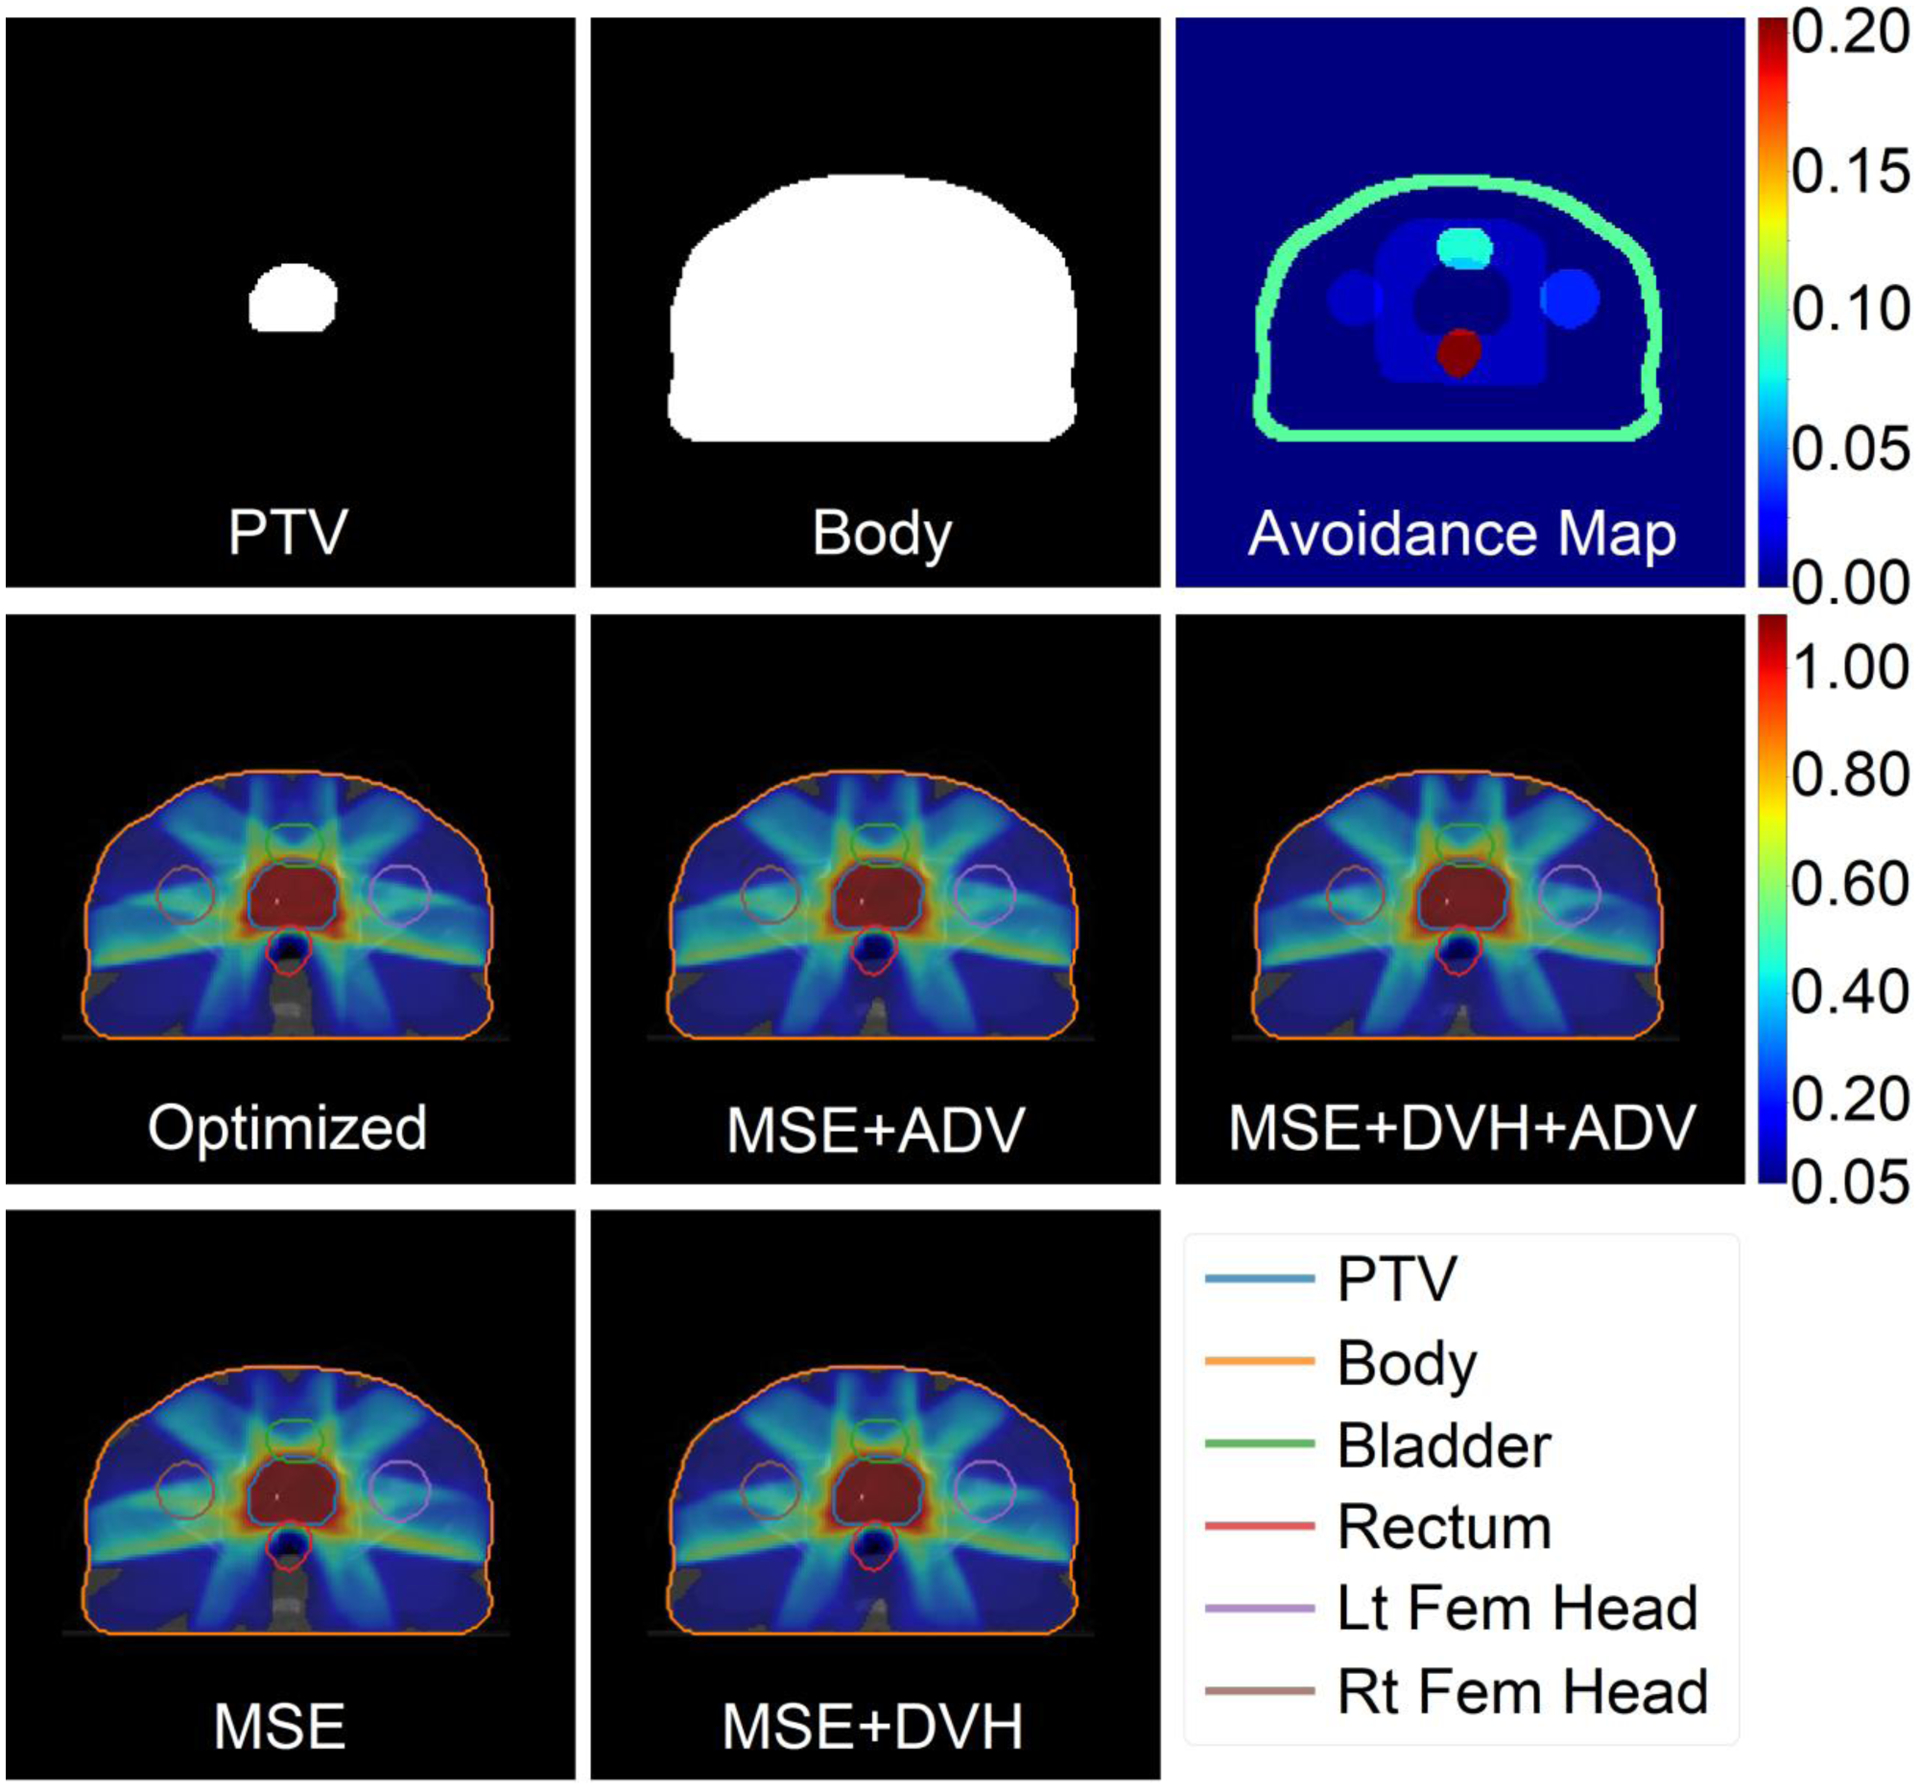
Figure 6:

Inputs, optimized dose, and predicted doses for a test patient and a rectum sparing plan. Top row: Inputs of the U-net neural network, which include the PTV assigned to its weight (wPTV = 1 in this example), a binary mask of the body, and the avoidance map containing the remaining organs-at-risk assigned to their respective tradeoff weight. Bottom two rows: Optimized and predicted dose washes of the Pareto optimal dose. The colorbar shows the doses between 5% and 110% of the prescription dose.
