Figure 7:

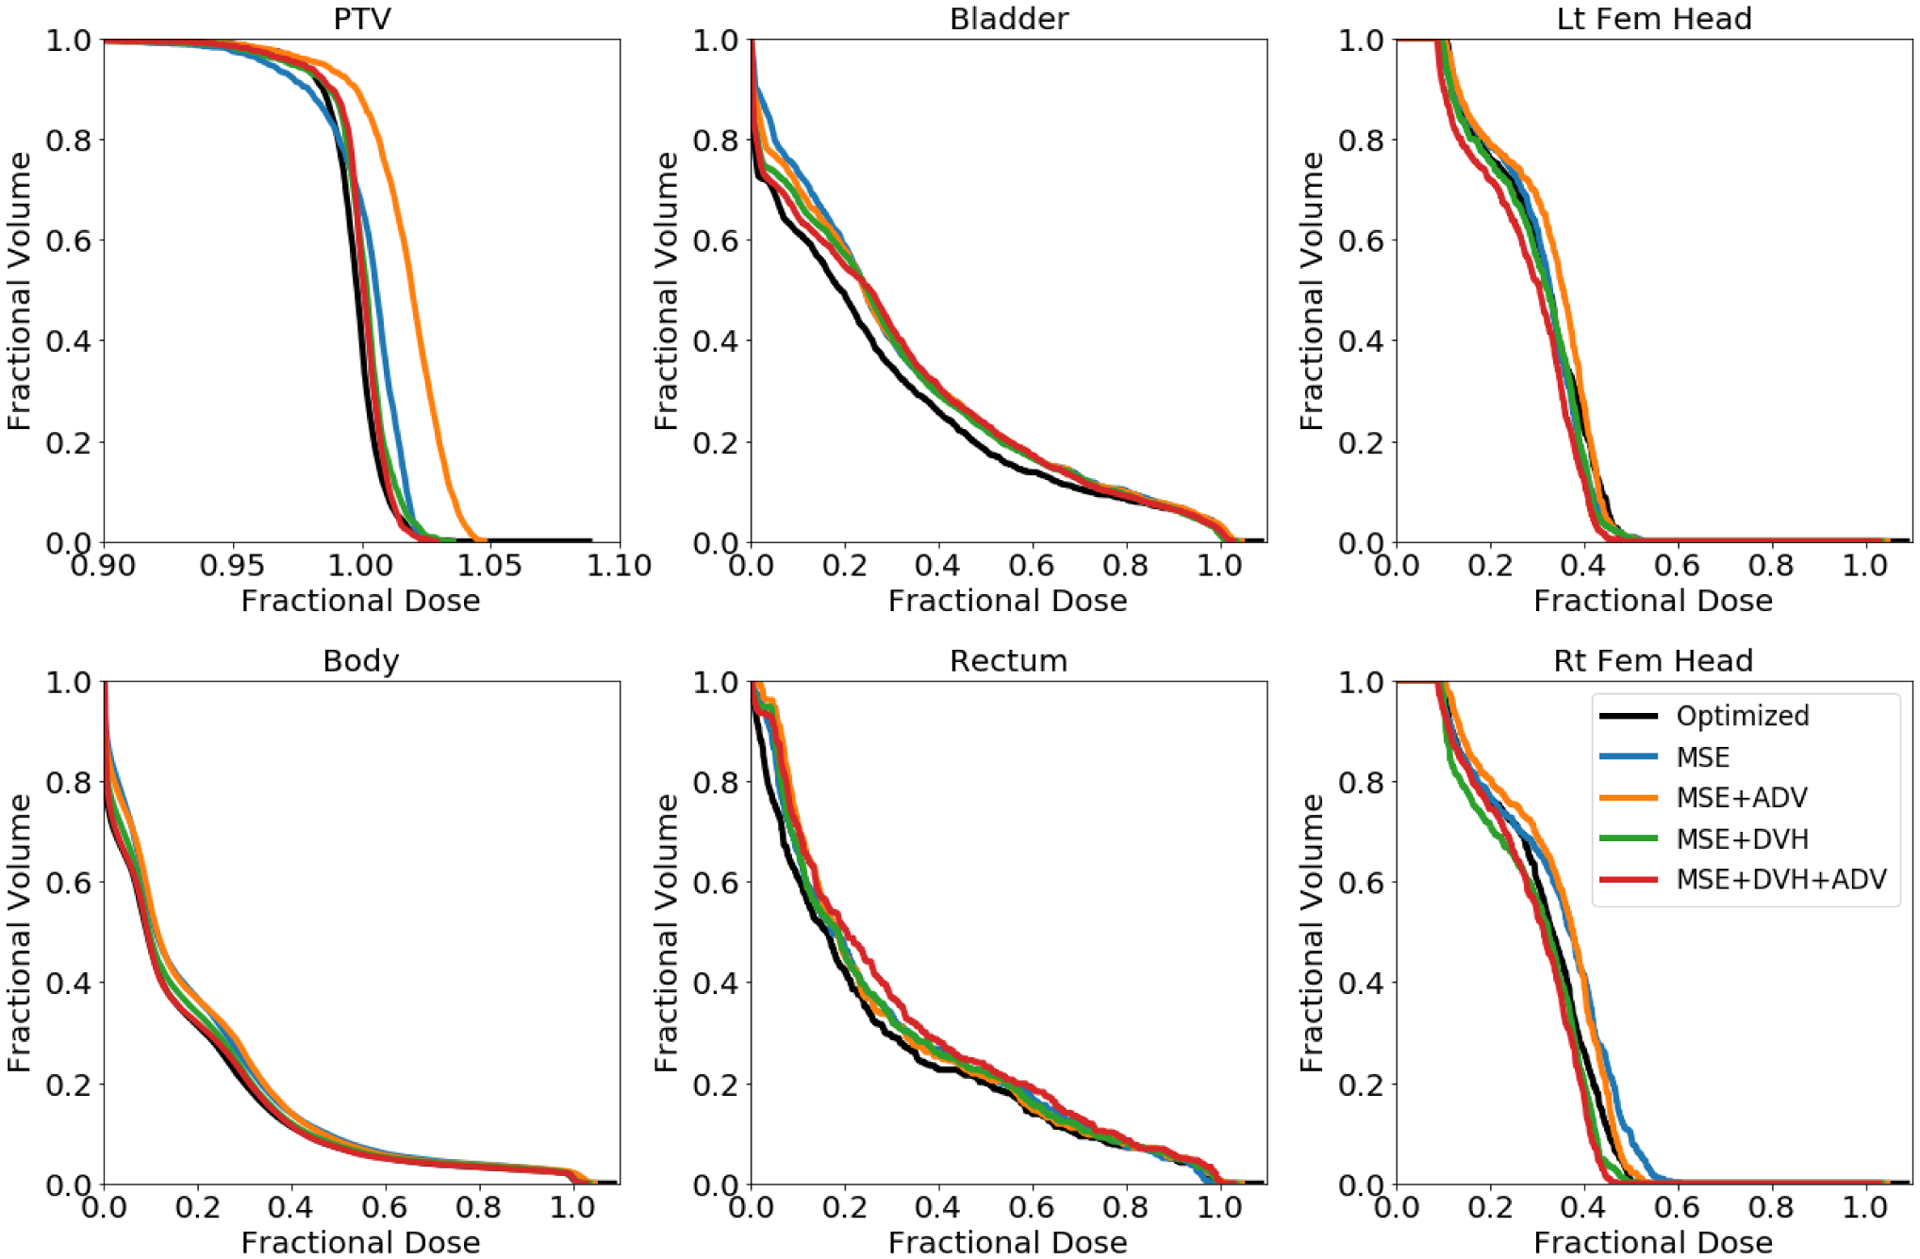
Dose volume histograms (DVH) of optimized dose distribution (black) and predicted dose distributions (various colors) for the same test patient as in Figure 6. Note the x-axis scale for the PTV DVH is different.

Dose volume histograms (DVH) of optimized dose distribution (black) and predicted dose distributions (various colors) for the same test patient as in Figure 6. Note the x-axis scale for the PTV DVH is different.