
Figure 7:
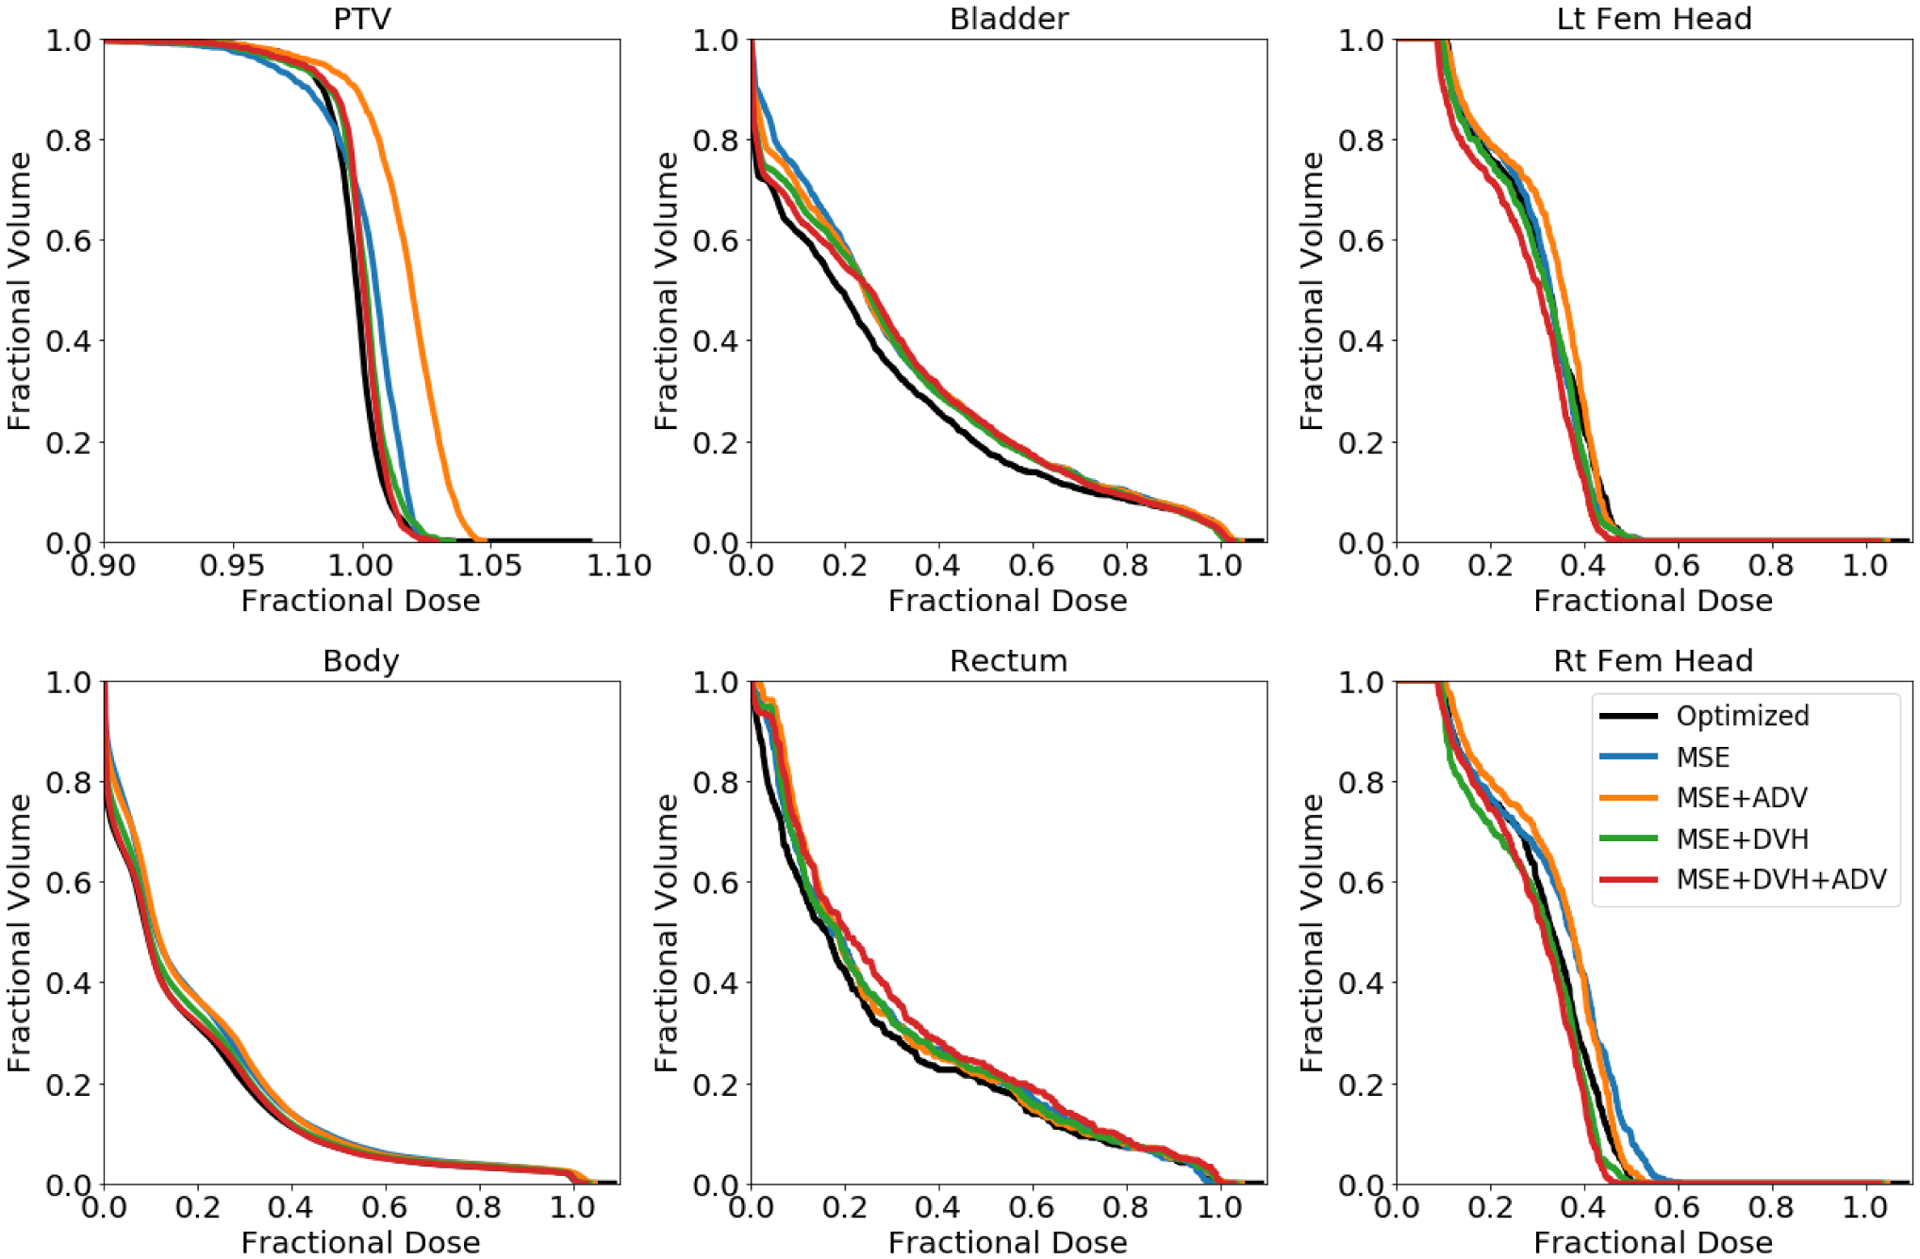
Dose volume histograms (DVH) of optimized dose distribution (black) and predicted dose distributions (various colors) for the same test patient as in Figure 6. Note the x-axis scale for the PTV DVH is different.
Official websites use .gov
A
.gov website belongs to an official
government organization in the United States.
Secure .gov websites use HTTPS
A lock (
) or https:// means you've safely
connected to the .gov website. Share sensitive
information only on official, secure websites.
Dose volume histograms (DVH) of optimized dose distribution (black) and predicted dose distributions (various colors) for the same test patient as in Figure 6. Note the x-axis scale for the PTV DVH is different.